
Turn on suggestions
Auto-suggest helps you quickly narrow down your search results by suggesting possible matches as you type.
Showing results for
Please log in to access translation
Turn on suggestions
Auto-suggest helps you quickly narrow down your search results by suggesting possible matches as you type.
Showing results for
- Community
- ThingWorx
- ThingWorx Developers
- how to apply state formatting to label chart or an...
Translate the entire conversation x
Please log in to access translation
Options
- Subscribe to RSS Feed
- Mark Topic as New
- Mark Topic as Read
- Float this Topic for Current User
- Bookmark
- Subscribe
- Mute
- Printer Friendly Page
how to apply state formatting to label chart or any other chart??
Mar 23, 2021
12:42 PM
- Mark as New
- Bookmark
- Subscribe
- Mute
- Subscribe to RSS Feed
- Permalink
- Notify Moderator
Please log in to access translation
Mar 23, 2021
12:42 PM
how to apply state formatting to label chart or any other chart??
Hello,
I want to apply below state formatting to label chart .Please suggest how do I apply state formatting??? and please refer below attachment
Thanks in advance
Solved! Go to Solution.
Labels:
- Tags:
- y
ACCEPTED SOLUTION
Accepted Solutions
Mar 25, 2021
04:39 AM
- Mark as New
- Bookmark
- Subscribe
- Mute
- Subscribe to RSS Feed
- Permalink
- Notify Moderator
Please log in to access translation
Mar 25, 2021
04:39 AM
Thanks for providing some details on your use case.
There is no out-of-the-box functionality in ThingWorx to display colored areas in the background depending on the value of the Y Axis. However, you can apply state-formatting to Label Charts using the Markers ChartType (or Line/Markers, Area/Markers) as shown in the attached screenshot Markers_StateFormatting.jpg.
You could possibly dedicate a certain number of series (= number of colors you want to display) displayed as Areas and then add a Line type series on top as shown in attached screenshot Areas+Line.jpg. This is not what the widget's multi-series functionality is originally intended for and this does involve the creation of Chart data especially for the formatting so I will let you decide if this is something worth implementing.
Another "cleaner" possibility would be to create a custom widget for this : Creating Customized ThingWorx Widgets.
4 REPLIES 4
Mar 24, 2021
03:21 AM
- Mark as New
- Bookmark
- Subscribe
- Mute
- Subscribe to RSS Feed
- Permalink
- Notify Moderator
Please log in to access translation
Mar 24, 2021
03:21 AM
Hi @RM12,
Please find attached some entities that can be imported into ThingWorx 8.5 or later and that contain a Mashup with a Label Chart using State-Formatting. At runtime you will see that all values below 5 are displayed in green and all above 5 in red.
Mar 24, 2021
04:12 AM
- Mark as New
- Bookmark
- Subscribe
- Mute
- Subscribe to RSS Feed
- Permalink
- Notify Moderator
Please log in to access translation
Mar 24, 2021
04:12 AM
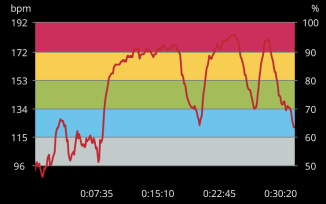
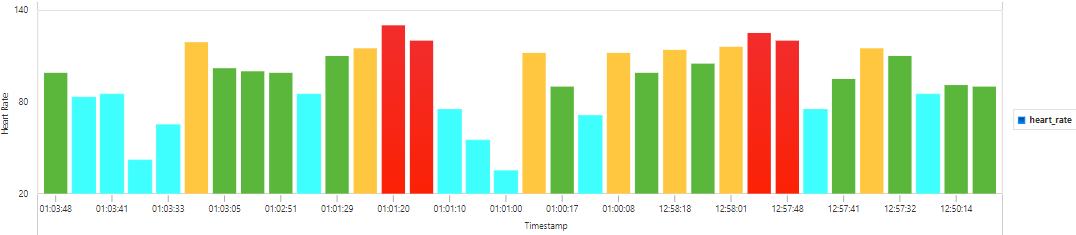
Thanks for your reply ,at runtime I will display my data with multiple colors .I want to display legends as well in dashboard, I have one property name as "Heart Rate" according to heart rate show legends as below condition :
1) less than or equals to 90 --Blue color
2) greater than 90 or less than 110 --green color
3) greater than 110 or less than 120 -- Yellow
4) greater than 120 --Red
please refer the below attachments and suggest how to display legends according to above condition ???
Mar 25, 2021
04:39 AM
- Mark as New
- Bookmark
- Subscribe
- Mute
- Subscribe to RSS Feed
- Permalink
- Notify Moderator
Please log in to access translation
Mar 25, 2021
04:39 AM
Thanks for providing some details on your use case.
There is no out-of-the-box functionality in ThingWorx to display colored areas in the background depending on the value of the Y Axis. However, you can apply state-formatting to Label Charts using the Markers ChartType (or Line/Markers, Area/Markers) as shown in the attached screenshot Markers_StateFormatting.jpg.
You could possibly dedicate a certain number of series (= number of colors you want to display) displayed as Areas and then add a Line type series on top as shown in attached screenshot Areas+Line.jpg. This is not what the widget's multi-series functionality is originally intended for and this does involve the creation of Chart data especially for the formatting so I will let you decide if this is something worth implementing.
Another "cleaner" possibility would be to create a custom widget for this : Creating Customized ThingWorx Widgets.
Apr 07, 2021
06:05 AM
- Mark as New
- Bookmark
- Subscribe
- Mute
- Subscribe to RSS Feed
- Permalink
- Notify Moderator
Please log in to access translation
Apr 07, 2021
06:05 AM
Hi @RM12
If the previous response answered your question, please mark it as the Accepted Solution for the benefit of others with the same question.
Regards,
Toolika Dixit


