
Turn on suggestions
Auto-suggest helps you quickly narrow down your search results by suggesting possible matches as you type.
Showing results for
Please log in to access translation
Turn on suggestions
Auto-suggest helps you quickly narrow down your search results by suggesting possible matches as you type.
Showing results for
- Community
- ThingWorx
- ThingWorx Developers
- Re: performance issues with an sql query service t...
Translate the entire conversation x
Please log in to access translation
Options
- Subscribe to RSS Feed
- Mark Topic as New
- Mark Topic as Read
- Float this Topic for Current User
- Bookmark
- Subscribe
- Mute
- Printer Friendly Page
performance issues with an sql query service that executes a stored procedure in MS SQL
Jan 21, 2019
03:29 PM
- Mark as New
- Bookmark
- Subscribe
- Mute
- Subscribe to RSS Feed
- Permalink
- Notify Moderator
Please log in to access translation
Jan 21, 2019
03:29 PM
performance issues with an sql query service that executes a stored procedure in MS SQL
I have a stored procedure defined in an MS SQL database, I have an sql query service defined in a thing template as follows:
SET NOCOUNT ON
EXEC [dbo].[sp_Local_GetWorkOrdersOperationStep_ByWO]
@WorkOrder = [[WorkOrder]]
where workorder is a test string
under previous versions of Thingworx (up to version 7.3) we had no issue (the service would run in about the same time it would take to run in server management studio -> between 5 and 15 seconds). We upgraded to 8.1 within the last 6 months and now I observe that this query generally takes anywhere from 45 seconds to several minutes. I have tried just about every ms sql jdbc driver available including (the latest preview release: mssql-jdbc-7.1.4.jre8-preview) and nothing has changed. I recently created a servlet to execute this stored procedure from and installed in on the same server. The servlet executes this stored procedure in 5 to 15 seconds (same as server management studio) which tells me the problem in occurring within Thingworx. I have this same code installed on about 7 different machines with each machine talking to the same database including my own laptop. Every one show this same poor performance with one exception: on my laptop I was able to define this sql query service directly in the thing (which is used to execute it) and it will execute in the same amount of time it takes in server management studio (or no other machine was this same behavior observed). I am not sure how to diagnose what is causing the poor performance so any insight would be greatly appreciated
Labels:
- Labels:
-
Extensions
-
Troubleshooting
-
TWX Dev Portal
9 REPLIES 9
Jan 23, 2019
04:36 PM
- Mark as New
- Bookmark
- Subscribe
- Mute
- Subscribe to RSS Feed
- Permalink
- Notify Moderator
Please log in to access translation
Jan 23, 2019
04:36 PM
Hello,
I see that you have the same query on all instances but the one that runs within the normal Timeframe is on your laptop. Is the instance on your laptop also the same version as the others or are you still running a version earlier than 7.3?
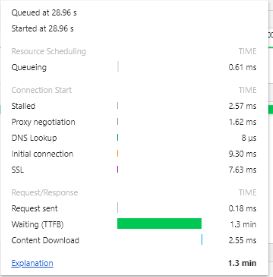
One one of the instances with slow performance, can you open the developer tools to the "Network" tab in the browser and then test the stored procedure? Then click on the waterfall information to display the breakdown of where time was spent executing the process? Please take a screen shot of this information as shown in the image below.

Jan 23, 2019
07:32 PM
- Mark as New
- Bookmark
- Subscribe
- Mute
- Subscribe to RSS Feed
- Permalink
- Notify Moderator
Please log in to access translation
Jan 23, 2019
07:32 PM
The result is attached
Almost all the time is spent waiting for the first byte of data.
Jan 23, 2019
07:33 PM
- Mark as New
- Bookmark
- Subscribe
- Mute
- Subscribe to RSS Feed
- Permalink
- Notify Moderator
Please log in to access translation
Jan 23, 2019
07:33 PM
Every single instance is using version 8.1
Jan 23, 2019
07:49 PM
- Mark as New
- Bookmark
- Subscribe
- Mute
- Subscribe to RSS Feed
- Permalink
- Notify Moderator
Please log in to access translation
Jan 23, 2019
07:49 PM
Where are the other servers located in relation to the database server? Are they hosted on premises or cloud hosted?
Jan 24, 2019
10:34 AM
- Mark as New
- Bookmark
- Subscribe
- Mute
- Subscribe to RSS Feed
- Permalink
- Notify Moderator
Please log in to access translation
Jan 24, 2019
10:34 AM
they are all in the cloud. I have an additional update after testing last night. I observed the following changes last evening. At one point the performance on the service from my machine that usually is very good degraded down to the level which is observed on every other machine (this lasted for about a half hour). Furthermore, the performance of the service on a couple of the other machines (which is bad most of the time) became very good for a few hours (not quite as good as executing the stored procedure directly in the servlet or in server management studio but within 80 to 90%).
Jan 24, 2019
08:28 PM
- Mark as New
- Bookmark
- Subscribe
- Mute
- Subscribe to RSS Feed
- Permalink
- Notify Moderator
Please log in to access translation
Jan 24, 2019
08:28 PM
I have another update on this. I created a java routine that uses the Thingworx Restful API to hit this stored procedure. I have had it running for several hours and It consistently returns the data in 5 seconds or less (this is even faster than server management studio)
Jan 25, 2019
03:50 PM
- Mark as New
- Bookmark
- Subscribe
- Mute
- Subscribe to RSS Feed
- Permalink
- Notify Moderator
Please log in to access translation
Jan 25, 2019
03:50 PM
It is interesting that testing the call from composer takes nearly a minute and 30 seconds for time to first byte, but executing the same service using the REST api returns in 5 seconds or less.
There are a few thing that I would like you to confirm and test
1. Is SSL configured for ThingWorx
2. Using the ThingWorx Support Tools, enable the stacktrace watchdog follow the instructions in the suppor tools article and set the interval to 10 seconds. Run the Database Stored Procedure service to collect stack trace logging which will save to /ThingworxStorage/repository/SupportTools.Repository
Using ThingWorx Support Tools Extension
Send the runstacktrace file
3. Use Wireshark to capture the traffic between the database and ThingWorx server, test the stored procedure service, and send the pcap file
Feb 04, 2019
04:03 PM
- Mark as New
- Bookmark
- Subscribe
- Mute
- Subscribe to RSS Feed
- Permalink
- Notify Moderator
Please log in to access translation
Feb 04, 2019
04:03 PM
Here is the latest update on this. Yes we are using SSL.
I have attached the stacktrace
I am working on obtaining the pcap file
I was wrong about executing the stored procedure through the restful API and having it run as fast or faster than it does using managemnt studio. I figured out it was not reading in the parameter used to do a search. Under this scenario it runs very fast. When I corrected it to read in the paramter it is as slow as running the service from the thing. The interesting observation is that this tells me there is no bottleneck in talking to the database and running the stored procedure. The stored procedure performs 4 seperate queries, with the last query taking at least 90% of the total time. If the search parameter is not read in it skips the last query and returns very fast. When it performs the last query it takes much longer to return when executing from the service rather than directly from either mangement studio or from a servlet
Feb 18, 2019
07:06 PM
- Mark as New
- Bookmark
- Subscribe
- Mute
- Subscribe to RSS Feed
- Permalink
- Notify Moderator
Please log in to access translation
Feb 18, 2019
07:06 PM
SSL will add to the return time to negotiate the connection with the database server. Please send the wireshark capture when you are able. I believe this will be the most useful log file.


