Turn on suggestions
Auto-suggest helps you quickly narrow down your search results by suggesting possible matches as you type.
Showing results for
Please log in to access translation
Turn on suggestions
Auto-suggest helps you quickly narrow down your search results by suggesting possible matches as you type.
Showing results for
- Community
- ThingWorx
- ThingWorx Developers
- "Step-Before" Format on Time Series Charts
Translate the entire conversation x
Please log in to access translation
Options
- Subscribe to RSS Feed
- Mark Topic as New
- Mark Topic as Read
- Float this Topic for Current User
- Bookmark
- Subscribe
- Mute
- Printer Friendly Page
"Step-Before" Format on Time Series Charts
Aug 03, 2015
05:52 AM
- Mark as New
- Bookmark
- Subscribe
- Mute
- Subscribe to RSS Feed
- Permalink
- Notify Moderator
Please log in to access translation
Aug 03, 2015
05:52 AM
"Step-Before" Format on Time Series Charts
Hi Guys
I am having a little bit of difficulty with the time series chart widget in Thingworx.
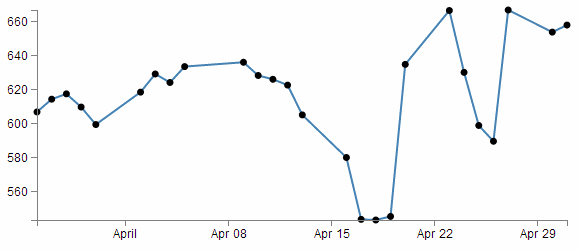
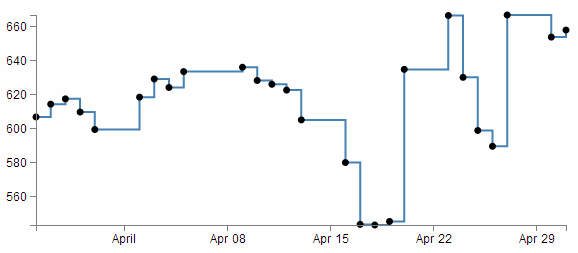
What I am trying to achieve is to present a graph that is presented in a “Step-Before” format as opposed to a “Linear” graph.
Is this possible with the “Time series chart” widget?
Linear:

Step-Before:

Any feedback would be highly appreciated.
Many thanks
Ashley
1 REPLY 1
Aug 04, 2015
05:02 PM
- Mark as New
- Bookmark
- Subscribe
- Mute
- Subscribe to RSS Feed
- Permalink
- Notify Moderator
Please log in to access translation
Aug 04, 2015
05:02 PM
Two thoughts to achieve this out of the box.
1. add additional points to get the horizontal move over before the vertical drop
2. custom widget
I actually tried this real quick with a bar chart but there are separations and the bar lines run to the zero so that won't work.


