Put your PDMLink system on a diet
http://sites.google.com/site/newvillagepdm/useful-sql-scripts/unused-family-tables
Without proper maintenance, you PDM system can become a little shop of horrors. Feed me, feed me, feed me! It should be the job of the system admin to make sure that items are purged and unrelated files cleared from the vaults. By what about the librarian's role? Are you using all the models that are in the system? What about large family table libraries of common hardware?

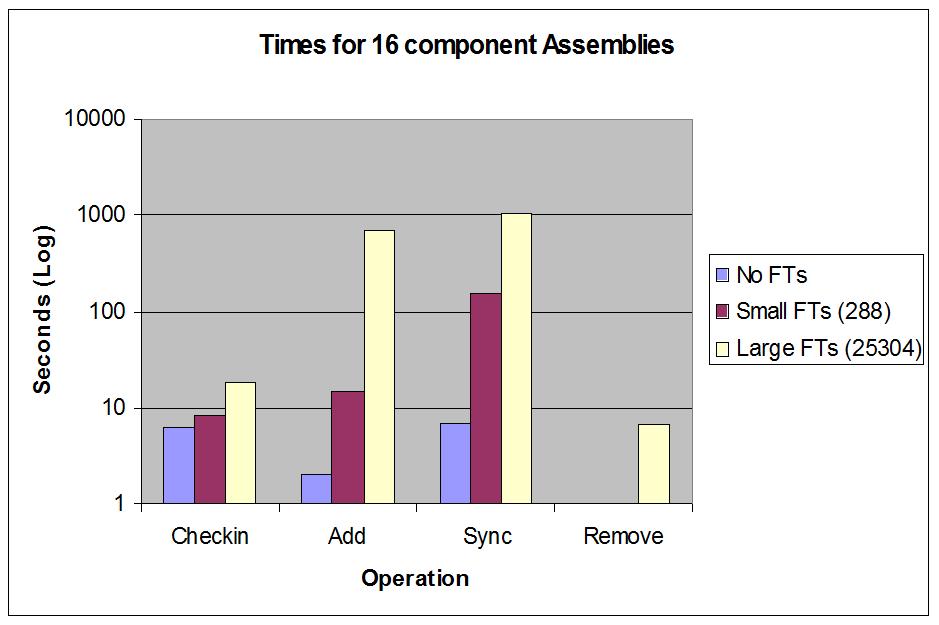
I noticed a while back the following behavior, workspace operation times seemed to be affected by the use of large family tables. To test I created a 16 part assembly, one with no family tables, one with small family tables, and the third with very large family tables. You can see the affect below. Note the log scale. Remember, there are less than 20 objects in the workspace for all of these. Slowness was on the server side.
So, how well am I using these family tables? Am I carrying instances that I never have used? I wrote this SQL query to answer that:
http://sites.google.com/site/newvillagepdm/useful-sql-scripts/library-part-stats---percent-used
It shows the generics from a library, number of instances and the percent used by cad assemblies. I got a chart like this from that data:
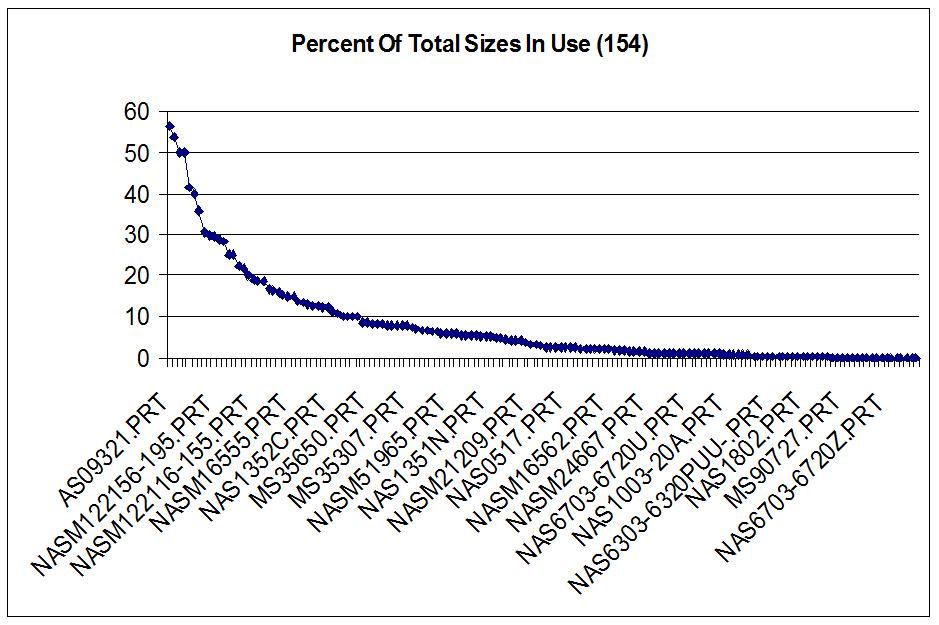
Ok, we are using very little of these families. Time to chuck them. There is a TPI in the knowledge base about removing family table instances from PDMLink. This needed to be modified since it was not practical for removing large numbers of instances, but it is possible. You'll need another query which, for a given generic number, lists what has been used by other assemblies. This is what you need to keep at a minimum:
http://sites.google.com/site/newvillagepdm/useful-sql-scripts/instances-used
And while you are at it, you might as well dump any families that show no usage at all. To find those, you this query:
http://sites.google.com/site/newvillagepdm/useful-sql-scripts/unused-family-tables
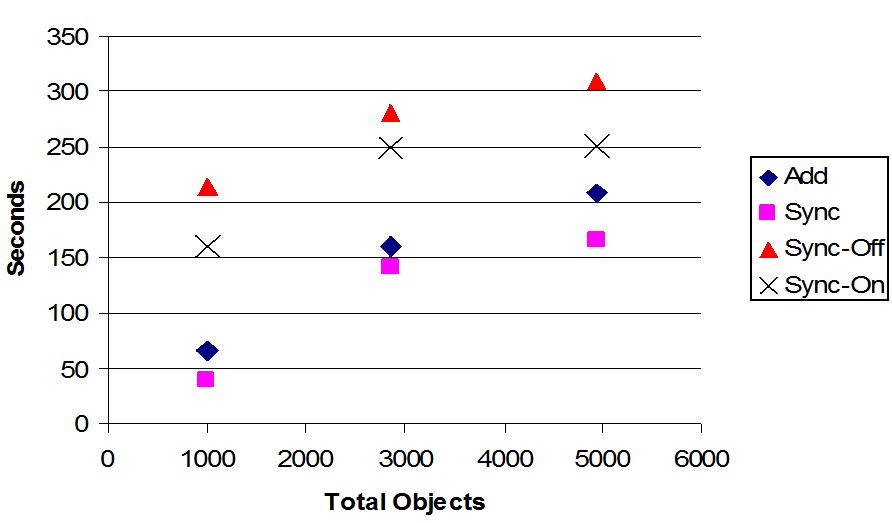
The results of all this was surprising and immediate. For assemblies that made use family tables that were reduced, we saw workspace times drop as the number of instances dropped. The object count represents the object count if you included all instances option when adding assembly to a workspace (so we can get a relative comparison).
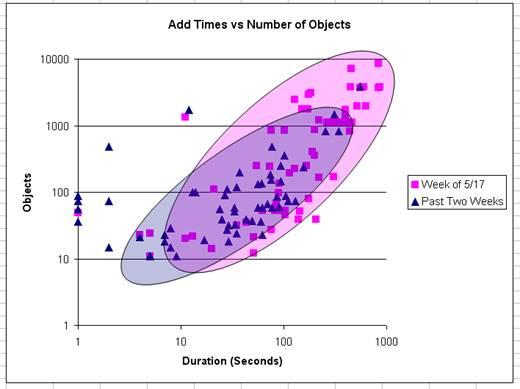
Finally, the macro effect. I am logging workspace operation information to a database using a utility that runs on Wildfire startup Wildfire Event Extractor. Below is a chart from that data showing add times vs. affected objects for the event. Note again, the log-log scale. The chart shows recent events have shifted down and to the left indicating overall system performance gains.