Turn on suggestions
Auto-suggest helps you quickly narrow down your search results by suggesting possible matches as you type.
Showing results for
Please log in to access translation
Turn on suggestions
Auto-suggest helps you quickly narrow down your search results by suggesting possible matches as you type.
Showing results for
Community Tip - You can change your system assigned username to something more personal in your community settings. X
- Community
- PLM
- Windchill Discussions
- Re: System Monitor - socketRead0
Translate the entire conversation x
Please log in to access translation
Options
- Subscribe to RSS Feed
- Mark Topic as New
- Mark Topic as Read
- Float this Topic for Current User
- Bookmark
- Subscribe
- Mute
- Printer Friendly Page
System Monitor - socketRead0
May 08, 2013
02:50 PM
- Mark as New
- Bookmark
- Subscribe
- Mute
- Subscribe to RSS Feed
- Permalink
- Notify Moderator
Please log in to access translation
May 08, 2013
02:50 PM
System Monitor - socketRead0
On most of my transactions in the PTC System Monitor I always see socketRead0(FileDescriptor, byte[], int, int, int) as being the highest execution time.
Anyone have some insight in to what is causing the high execution time? Not sure where to start to track it down.
5 REPLIES 5
May 08, 2013
04:28 PM
- Mark as New
- Bookmark
- Subscribe
- Mute
- Subscribe to RSS Feed
- Permalink
- Notify Moderator
Please log in to access translation
May 08, 2013
04:28 PM
Hey man, I am a huge fan of PSM and I see that all the time. Here is the explanation I believe:
http://javaeesupportpatterns.blogspot.com/2011/08/javanetsocketinputstreamsocketread0.html
Hope it helps!
May 08, 2013
04:42 PM
- Mark as New
- Bookmark
- Subscribe
- Mute
- Subscribe to RSS Feed
- Permalink
- Notify Moderator
Please log in to access translation
May 08, 2013
04:42 PM
Thanks Andy. That looks to be the exact issue. Have you opened calls with PTC support on this? Did they come back with any resolution for you?
May 08, 2013
05:07 PM
- Mark as New
- Bookmark
- Subscribe
- Mute
- Subscribe to RSS Feed
- Permalink
- Notify Moderator
Please log in to access translation
May 08, 2013
05:07 PM
Gotta be honest with you, I sure haven't. I see it often and have been curious but I am sure you can relate when I say that I have time only to open tickets for the broken stuff right now  in preparation for PTCPlanet.
This makes a lot of sense and my Dev team confirmed that it is legit. That's good enough for me 
May 09, 2013
03:52 AM
- Mark as New
- Bookmark
- Subscribe
- Mute
- Subscribe to RSS Feed
- Permalink
- Notify Moderator
Please log in to access translation
May 09, 2013
03:52 AM
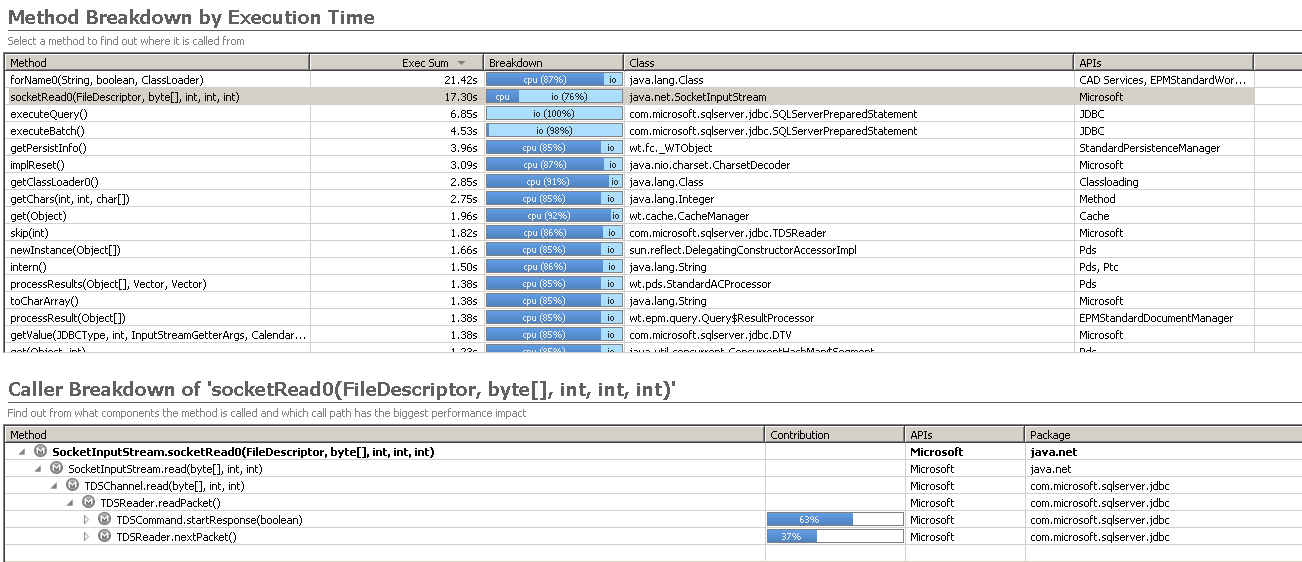
Looking at the caller breakdown it seems clear that the socketRead0's in question are JDBC calls waiting on responses from SQL Server. Thus the better question may be why your SQL Server is so slow to respond.
May 09, 2013
08:40 AM
- Mark as New
- Bookmark
- Subscribe
- Mute
- Subscribe to RSS Feed
- Permalink
- Notify Moderator
Please log in to access translation
May 09, 2013
08:40 AM
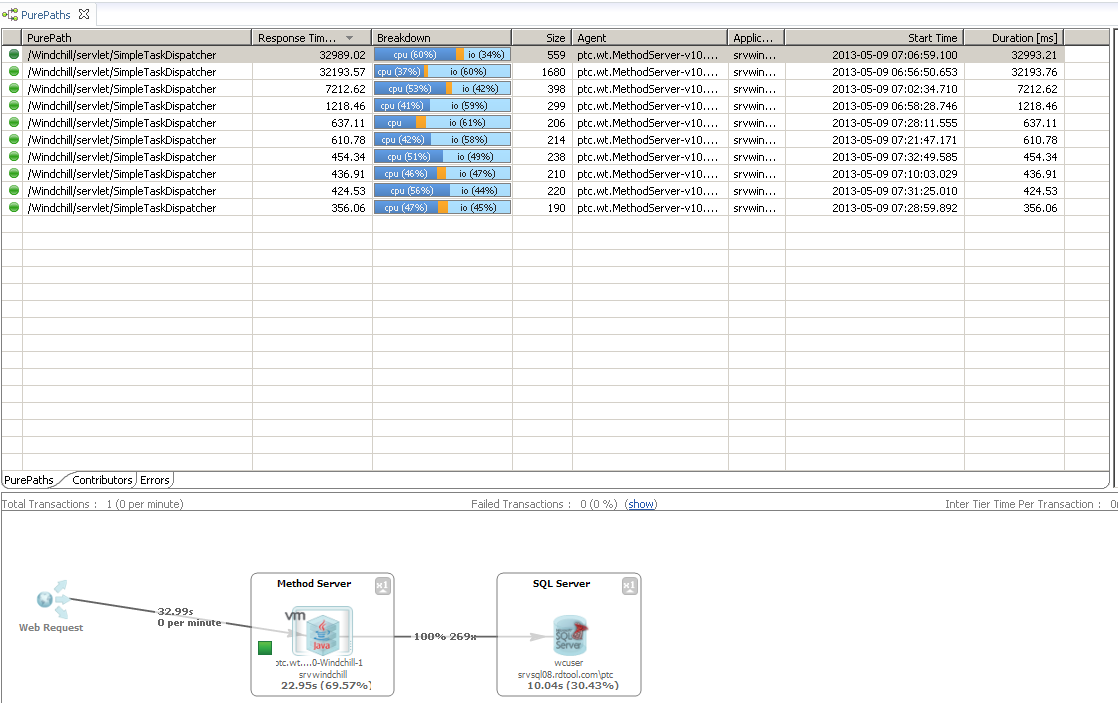
Here is an Add To Workspace that took 32.99 seconds. Of that 32.99 seconds 22.95 was spent in the method server and 10.04 was spent in SQL Server.