Turn on suggestions
Auto-suggest helps you quickly narrow down your search results by suggesting possible matches as you type.
Showing results for
Please log in to access translation
Turn on suggestions
Auto-suggest helps you quickly narrow down your search results by suggesting possible matches as you type.
Showing results for
Community Tip - When posting, your subject should be specific and summarize your question. Here are some additional tips on asking a great question. X
- Community
- PLM
- Windchill Discussions
- Re: What is considered a "critical" point for low ...
Translate the entire conversation x
Please log in to access translation
Options
- Subscribe to RSS Feed
- Mark Topic as New
- Mark Topic as Read
- Float this Topic for Current User
- Bookmark
- Subscribe
- Mute
- Printer Friendly Page
What is considered a "critical" point for low Server Memory?
May 13, 2014
10:20 AM
- Mark as New
- Bookmark
- Subscribe
- Mute
- Subscribe to RSS Feed
- Permalink
- Notify Moderator
Please log in to access translation
May 13, 2014
10:20 AM
What is considered a "critical" point for low Server Memory?
I have been monitoring the memory of our Windchill 10.1 Server the last few days. It is currently at 85% used physical memory. What is considered to be the critical point?
Is there a way to clear the memory without actually shutting down the server?
Solved! Go to Solution.
Labels:
- Labels:
-
Other
ACCEPTED SOLUTION
Accepted Solutions
May 14, 2014
09:52 AM
- Mark as New
- Bookmark
- Subscribe
- Mute
- Subscribe to RSS Feed
- Permalink
- Notify Moderator
Please log in to access translation
May 14, 2014
09:52 AM
The "Available System Memory" statistic is provided by the JVM itself, so the server status page is just passing this information along -- for whatever it is worth.
Unforrtunately, it doesn't seem to be worth a whole lot in practice.
On many UNIX systems this statistic is utterly meaningless -- as the OS automatically uses more and more of the free memory as a disk IO cache. That's great, since the OS will automatically provide this memory to processes for other purposes as needed and in the mean time IO performance is improved. The problem is that the OS calls made by the JVM to obtain this statistic don't consider such disk cache memory as "available" or "free", so you'll generally see almost no physical memory available on a UNIX machine if it has been running for any substantial period of time.
On Windows I believe this statistic might be somewhat more meaningful, but still I'd not really put too much stock in it -- unless/until you verify that this statistic really seems to indicate something meaningful.
A final note: Java processes grab large blocks of memory for their heap, perm gen, etc. In cases they won't grab the maximum possible immediately (depending on one's configuration), but after one's has experienced a period of reasonably high load these blocks are likely to have grown as large as they will. After that point the OS doesn't necessarily need a huge amount of free memory -- as the JVM's have grabbed their own free memory pools for various usages.
4 REPLIES 4
May 14, 2014
07:53 AM
- Mark as New
- Bookmark
- Subscribe
- Mute
- Subscribe to RSS Feed
- Permalink
- Notify Moderator
Please log in to access translation
May 14, 2014
07:53 AM
How are you monitoring this usage?
I ask since you mention "85% used physical memory".
A few notes:
- No Java server process, Windchill or otherwise, should be configured in such a way that its memory may end up being swapped between physical and virtual memory. JVM heaps swap very badly and performance will be really awful.'
- For most cases the important thing to look at with JVMs is the heap allocation. And there the important thing to look at is the memory usage after garbage collection. If you look at memory usage prior to garbage collection, then you really don't learn much. You know that at most the amount of memory usage reported is being used -- but you have literally no idea how much of that is actually being referenced vs. how much would be quickly freed upon a garbage collection. Thus for Java and Windchill's JMX statistics and thresholds, the most critical ones are those with "Coll" in their names -- as these indicate statistics and thresholds after a garbage collection. As for overall heap statistics, the only real ways to get information on heap usage after a garbage collection are to (a) force one and then examine the heap usage immediately thereafter or (b) enable GC logging and read the GC logs. If you disable explicit GC, then you disable approach (a) and a number of mechanisms in Windchill that are intended to deal with low memory situations.
- Generally speaking if you're not seeing a substantial percentage of time being spent in garbage collection and not running out of memory upon any operation, then you're okay as far as memory is concerned. Of course the question is if you don't have a good amount of free JVM heap at idle, then how many requests and of what size of operations can you expect to handle before running into such issues.
- As far as clearing memory without shutting down the server, there's no real way to do this. You could invoke an explicit GC (again assuming you've not disabled this) via a JMX client like VisualVM or JConsole, but that just frees memory that the JVM itself would have freed when it needed more memory. Memory not freed by garbage collection is not freed because something is referencing and thus using it. If it isn't really necessary, then it should not be referenced/used. If the amount of memory used continues to grow without a plateau, then that would seem to indicate a memory leak -- and the only real way to get to the bottom of this is to force a heap dump [ideally when the system is idle in this case] and then analyze this (or, more likely, get PTC technical support to analyze this).
- PermGen memory usage should generally grow only when the Java process in question uses classes (and thus features/functionalities) that it hasn't used yet. This tends to grow slowly after initial startup and plateau over time. You can run this quite close to full -- as long as you never actually get an OutOfMemoryError due to perm gen. The out-of-the-box perm gen sizing is intended to suffice, though it may not in cases.
Sorry to be long-winded, but I think that pretty well covers it.
May 14, 2014
09:35 AM
- Mark as New
- Bookmark
- Subscribe
- Mute
- Subscribe to RSS Feed
- Permalink
- Notify Moderator
Please log in to access translation
May 14, 2014
09:35 AM
Jess M. Thanks so much for all the information.
We are monitoring using Server Manager - Diagnostics - Performance.
Today the monitor indicates that the used physical memory is at 87%.
I have inserted a screen shot of the Server status.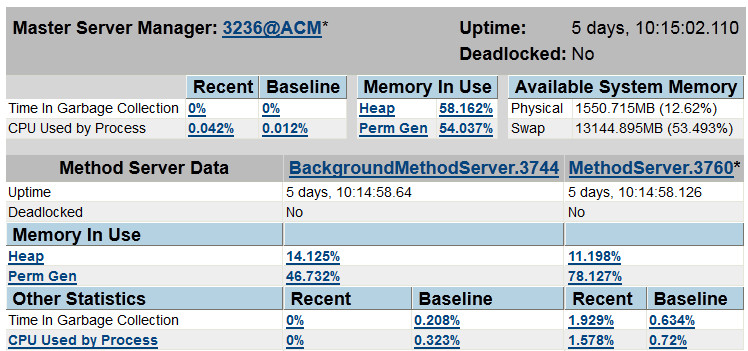
May 14, 2014
09:52 AM
- Mark as New
- Bookmark
- Subscribe
- Mute
- Subscribe to RSS Feed
- Permalink
- Notify Moderator
Please log in to access translation
May 14, 2014
09:52 AM
The "Available System Memory" statistic is provided by the JVM itself, so the server status page is just passing this information along -- for whatever it is worth.
Unforrtunately, it doesn't seem to be worth a whole lot in practice.
On many UNIX systems this statistic is utterly meaningless -- as the OS automatically uses more and more of the free memory as a disk IO cache. That's great, since the OS will automatically provide this memory to processes for other purposes as needed and in the mean time IO performance is improved. The problem is that the OS calls made by the JVM to obtain this statistic don't consider such disk cache memory as "available" or "free", so you'll generally see almost no physical memory available on a UNIX machine if it has been running for any substantial period of time.
On Windows I believe this statistic might be somewhat more meaningful, but still I'd not really put too much stock in it -- unless/until you verify that this statistic really seems to indicate something meaningful.
A final note: Java processes grab large blocks of memory for their heap, perm gen, etc. In cases they won't grab the maximum possible immediately (depending on one's configuration), but after one's has experienced a period of reasonably high load these blocks are likely to have grown as large as they will. After that point the OS doesn't necessarily need a huge amount of free memory -- as the JVM's have grabbed their own free memory pools for various usages.
May 14, 2014
09:58 AM
- Mark as New
- Bookmark
- Subscribe
- Mute
- Subscribe to RSS Feed
- Permalink
- Notify Moderator
Please log in to access translation
May 14, 2014
09:58 AM
Very helpful...Thanks a bunch!!!