Community Tip - Did you know you can set a signature that will be added to all your posts? Set it here! X
- Subscribe to RSS Feed
- Mark Topic as New
- Mark Topic as Read
- Float this Topic for Current User
- Bookmark
- Subscribe
- Mute
- Printer Friendly Page
Solid Helix with Surface Color defined by Independent Variable
- Mark as New
- Bookmark
- Subscribe
- Mute
- Subscribe to RSS Feed
- Permalink
- Notify Moderator
Solid Helix with Surface Color defined by Independent Variable
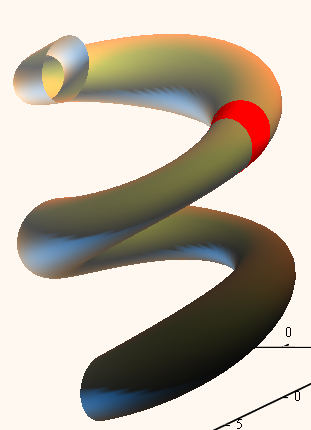
I am trying to analyze a coil spring like structure for stress along the length of the helix. Is it possible to 3D plot a helix with thickness and a surface color along its length that is controlled by an independent variable?
- Labels:
-
Other
- Mark as New
- Bookmark
- Subscribe
- Mute
- Subscribe to RSS Feed
- Permalink
- Notify Moderator
The thickness would be part of the data to be plotted and this has to be calculated beforehand - so it will be dependent on a variable anyway, I guess.
MC 3D Plots unfortunately does not support making display properties like color, light, viewing angle, grid numbers, ranges, ets. dependend on variables. The best you can do is using user defined colormaps.
Mabe this thread could help in that respect (while the main goal of it is something else) http://communities.ptc.com/message/195561#195561
Nevertheless it depends upon what you are after in specific if there is a workaround and solution. E.g. if you just want to higlight a specific region depending upon a variable you could create a second plot in the same graph and format that in different color. So you could create an extra plot for every part of the helox which should be in a specific color (which can depend on a parameter) and so plot the helix piece by piece. So the colors itself would be predefined in the graph, but the data to be plotted in a specific color would change depending on your calculations.

- Mark as New
- Bookmark
- Subscribe
- Mute
- Subscribe to RSS Feed
- Permalink
- Notify Moderator
Nice animation. I think it's not really what Douglas is looking for, but it's nice anyway ![]()
- Mark as New
- Bookmark
- Subscribe
- Mute
- Subscribe to RSS Feed
- Permalink
- Notify Moderator
That would require a colormap that is a function of at least two coordinates. That is not possible. This sort of graphing capability (for both 2D and 3D graphs) has been requested many times, for more than a decade. Unfortunately, other things have been deemed to be more important.
- Mark as New
- Bookmark
- Subscribe
- Mute
- Subscribe to RSS Feed
- Permalink
- Notify Moderator
As we can't map the color to the data in 3D plots I suggested to map the data to the predefined colors. It depends on what the used datastructure is, but it wouldl get rather clumsy in any way, I guess.
- Mark as New
- Bookmark
- Subscribe
- Mute
- Subscribe to RSS Feed
- Permalink
- Notify Moderator
If the stress could be defined in terms of only one coordinate a custom colormap would work, but I am sure the stress distribution is not that simple.
- Mark as New
- Bookmark
- Subscribe
- Mute
- Subscribe to RSS Feed
- Permalink
- Notify Moderator
No, I was not speaking of a custom colormap. Rather implementing a number of differently colored plots in the graph and then creating a 3D datastructure consisting of all points which should be red, etc. Guess it would be necessary to resort to scatter plot rather than surface plot. Not really satisfactory, but maybe a compromise.
- Mark as New
- Bookmark
- Subscribe
- Mute
- Subscribe to RSS Feed
- Permalink
- Notify Moderator
Found time to create a demo sheet to show what I was was thinking of - should get I life.
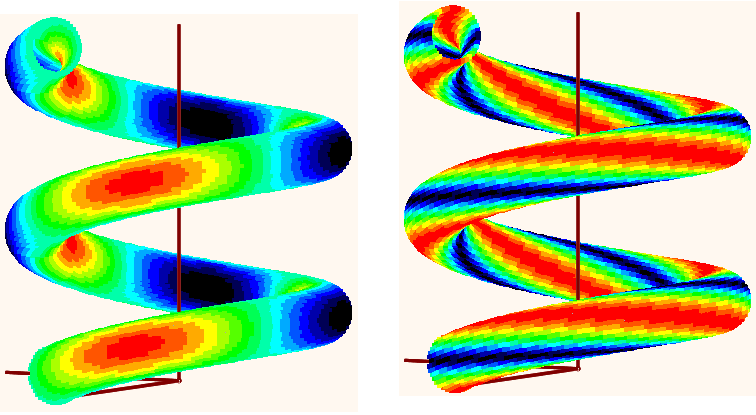
So here is a 2 coordinate colormap. The graph is prepared to use 16 colors but could be changed for more. Used two dummy functions for demonstration. Unfortunately it only works using scatter plot, so we need a rather dense grid which slows Mathcad down.
Also included another animation to demonstrate we could change color mapping over time 😉

- Mark as New
- Bookmark
- Subscribe
- Mute
- Subscribe to RSS Feed
- Permalink
- Notify Moderator
Werner,
This is really interesting. It is not quite what I need but perhaps it could be made to work. My analysis is in only one dimensional with respect to stress so the stress is actually very low on the bottom and then rises as you travel along the length of the spring and either stays the same at the top or may possibly reduce stress again. Is there a way to generate the map such that the colors are the same around the circumference of the wire but vary along its length? If so perhaps the color map could be the stress as a function of length and the map width could match the spring wire length. It seems like if we just play with the angle of the rainbow map and the mapping of its colors...
-Doug
- Mark as New
- Bookmark
- Subscribe
- Mute
- Subscribe to RSS Feed
- Permalink
- Notify Moderator
I had chosen a simple parametric representation for the helix. I don't know what you have in your sheet. BTW, my spring isn't a real one, as the generating circle is in a plane parallel to the z-axis. For a correct spring it should be in a plane perpendicular to the centerline helix.
I had provided two different dummy routines wert1() and wert2() which should be replaced by a routine of yours which would calculate the stress for each combination of the two parameters u and v, that is for every point on the surface of the spring. Then you could use the small routine map() to map the stress values to color indices.
The six parameters of map are: w ... the function which yields a (stress) value for every pair of coordinates
u, v ... the two independend parameters,
lo, hi ... minimum and maximum value the function w() will return - easy to see with my dummy routines. You will have to explore your function first to find these values. Its mandatory hat no value in the range you later wish to plot yields a value outside these boundaries.
nr .. number of color indices to map to. As I prepared the graph for 16 colors, thats that value which is thrown in later.
After that you would call the routine make_3D which returns a heavily nested matrix which is needed for graphing.
The parameters are:
Surf ... a function in two parameters which describes the surface to be plotted
col ... a function in the same two parameters which returns a color index (in my example 0..15) for every pair of coordinates
u0, u1 ... range for the first parameter (I later chose 0..2pi for the complete circumfence)
v0, v1 ... range for the second parameter (I later chose 0..4pi for two helix turns)
ugrid, vgrid ... the number of points for every parameter; as we only plot points we need a rather dense grid. You may experiment with less values and increase point size (now 2.0) for the last 16 plots.
nr ... again the number of colors, needed to initialize the matrix
The colors itself can only be changed manually by editing the properties of the graph. Thats rather tedious as would be preparing a graph for more than 16 colors. As was already said Mathcad provides no way to use variables here. The colormap in the second collapsed region has no influence on the colors in the 3D plot. It and the contour maps served for demonstration only. The whole region could be deleted without damage.
So if you, as I guess, already have setup a function describing the surface and another for calculation of the stress value for every surface point, you should be able to apply the principle in my sheet rather quick.
Good luck!
- Mark as New
- Bookmark
- Subscribe
- Mute
- Subscribe to RSS Feed
- Permalink
- Notify Moderator
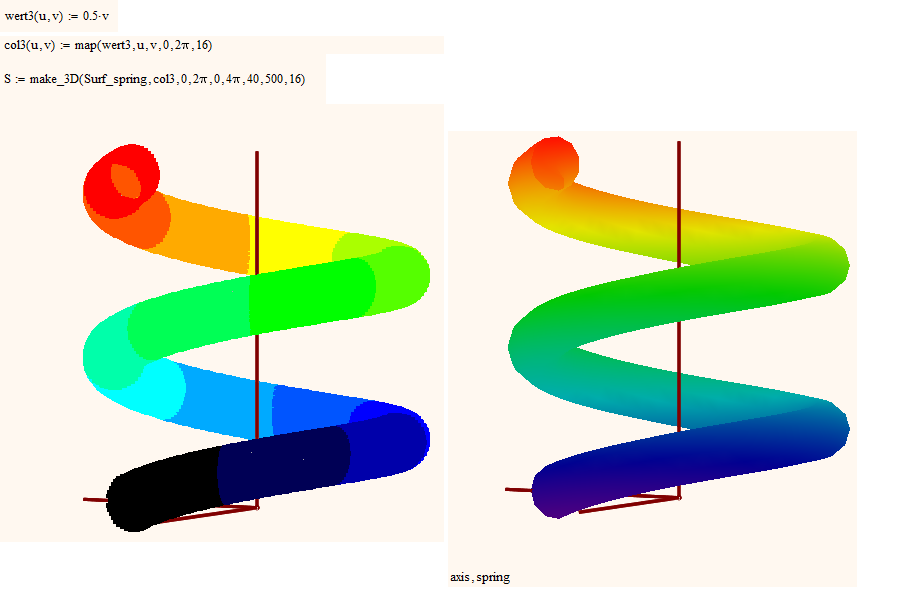
Just an afterthought. Your description of the stress values sounded quite simple. It would be a function which (in my model) is dependend on v only, not on u.
Even a linear function will do what you describe. But then, the result is rather similar to the simple use of a colormap dependend on z-values - out of the box, prettier and much quicker (see below, especially the difference betwen 16 and 256 colore ;-). But of course using the normal colormap won't give you much control and its not exactly the same as we don't have the same color around the circumfence but rather only at the same height..

- Mark as New
- Bookmark
- Subscribe
- Mute
- Subscribe to RSS Feed
- Permalink
- Notify Moderator
Correction: There was asmall error in V3 of the sheet - here is a correted version, supplemented by some further "stripe" maps.
- Mark as New
- Bookmark
- Subscribe
- Mute
- Subscribe to RSS Feed
- Permalink
- Notify Moderator
Werner,
I really appreciate the help you have been giving. I have been off on some other tasks the last few days but intend to pick this one back up next week.
Thank you,
Doug
- Mark as New
- Bookmark
- Subscribe
- Mute
- Subscribe to RSS Feed
- Permalink
- Notify Moderator
Richard Jackson wrote:
If the stress could be defined in terms of only one coordinate a custom colormap would work,
How?
According to Doug his stress analysis is one dimensional (while I doubt that the stress will really be the same around the circumfence of the wire).
Nevertheless how would a colormap help? (I know I had suggested c.maps in the first place here, but on second thought I guess I have to withdraw that proposal).
- Mark as New
- Bookmark
- Subscribe
- Mute
- Subscribe to RSS Feed
- Permalink
- Notify Moderator
The stress will not really be the same around the circumference of the wire however that is a simplifyng assumption for this analysis. So the spring is a vertical helix with the stress varying with respect to height of the centerline of the spring wire. So perhaps a custom color map that maps colors to stress as a function of one axis of the color map that is then aligned with the length of the spring helix would work?
- Mark as New
- Bookmark
- Subscribe
- Mute
- Subscribe to RSS Feed
- Permalink
- Notify Moderator
So perhaps a custom color map that maps colors to stress as a function of one axis of the color map that is then aligned with the length of the spring helix would work?
How would you do that?
Can you post your sheet to show how you have modelled and represented the helix for plotting and what your stress function is exactly? It would help, of course, if the stress function is dependent on the same parameter(s) as the surface representation, which probably won't be the curve length.
- Mark as New
- Bookmark
- Subscribe
- Mute
- Subscribe to RSS Feed
- Permalink
- Notify Moderator
From an engineering perspective a coil spring is simply a torsion bar which has been wound into a helix. Can you not anayse the stress for a straight bar? Give that in an ideal world the material quiality will be uniform along the lenght of the spring the stress should surely be uniform; leaving aside harmonic oscilations. Or am I completly missing the point?
- Mark as New
- Bookmark
- Subscribe
- Mute
- Subscribe to RSS Feed
- Permalink
- Notify Moderator
This is not really a torsion spring. It is a helix but I cannot go in any more detail in this forum. For the purposes of this discussion it is just a helix with a stress that I calculate that is a function independent of the helix but varying along the length of the wire. I would like to present it this way as a 3D helix that is colored to represent stress.


