Community Tip - New to the community? Learn how to post a question and get help from PTC and industry experts! X
- Subscribe to RSS Feed
- Mark Topic as New
- Mark Topic as Read
- Float this Topic for Current User
- Bookmark
- Subscribe
- Mute
- Printer Friendly Page
Fitting a function to Data
- Mark as New
- Bookmark
- Subscribe
- Mute
- Subscribe to RSS Feed
- Permalink
- Notify Moderator
Fitting a function to Data
Attached is a Prime 3 document which has a data table and graph. I have been trying to fit a function to this data but all my attempts have failed using the canned curve fit functions. Does anyone have a specialised proceedure which will do the job?
Thanking you in advance.
Regards, Mark
Solved! Go to Solution.
- Labels:
-
Statistics_Analysis
Accepted Solutions
- Mark as New
- Bookmark
- Subscribe
- Mute
- Subscribe to RSS Feed
- Permalink
- Notify Moderator
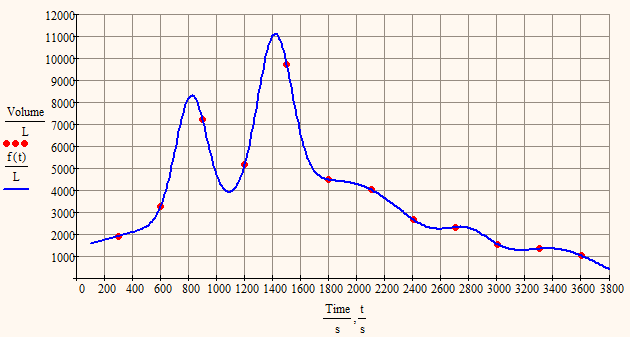
I played around a bit with your data and found a sum of 6 Gaussians which fit pretty well.
I didn't use genfit() but minerr() as the results will be the same and with minerr() the whole thing is better managable. I used Mathcad 15 for this because that version is much more user friendly and and quicker reacting and converted the sheet later in P3 format - just in case you are wondering why the datavectors are defined in a different way.
You may play around with the number of summands and the guess value and i think you will get good fits with less summands, too. But you will notice that the fit is VERY sensible wrt the guess values (just change the top left 1010 in Matrix M to 1020 or to 1000 and see yourself).
I'm not sure but I guess you'll like the splined f1 in my last post more.
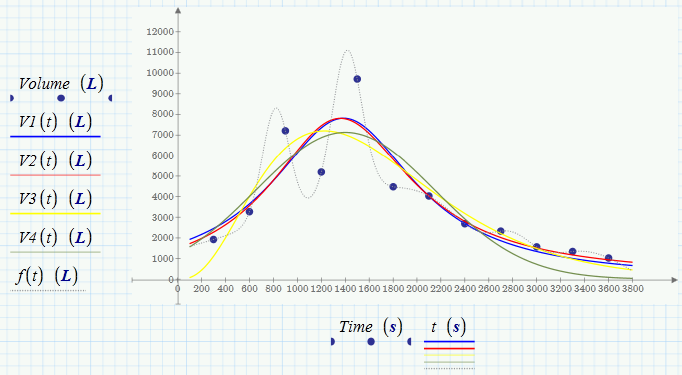
But as you wrote that the data is synthetic hydrograph I would imagine that the other two regressions in my previous post are describuig the event more realistic as they don't follow every peak and valley.

- Mark as New
- Bookmark
- Subscribe
- Mute
- Subscribe to RSS Feed
- Permalink
- Notify Moderator
- I don't see anything you have tried! What do you mean with "all my attempts have failed"? Didn't it work and you got an error message or was the fit not good enough in your opinion (then: what did you expect?)?
- What do you know about your data? Any functional behaviour you know about? You could use genfit() for your purpose but you will have to provide the kind of formula (polyinomials, combination of gaussians, or whatever) which you think will fit best.
- The values at 1200, 1500 sec may be outliers, you may consider dealing with them first before trying a fit (cutting off, or smoothing). Would this be an option?
- Whats the purpose of the fit? What will you do with the fitting function? Would an interpolation (spline or even linear) also do the job?
- Mark as New
- Bookmark
- Subscribe
- Mute
- Subscribe to RSS Feed
- Permalink
- Notify Moderator
Werner,
Sorry for the bad explanation. I did try various polynomial curve fit with various degrees 6 through 10 but with no luck i.e. the goodness of fit is bad as it doesn't fit the shape of the curve very well. Also tried another graphing program I have which has many other functions log fit, exponential fits etc all seem to fit very poorly. Also tried MS Excel linear fits etc. etc. No standard function seems to fit this data which is a synthetic hydrograph. If I get a good fitting function I can integrate the curve or route it through a reservoir using the solve function in Mathcad i.e. I would have to write a program using Eulers method etc which is prone to error. I seem to recall someone telling me that Mathematica had an advanced database of functions which it would try use one by one until it got the best match. Can genfit() do a similiar thing i.e. fins a function automatically? Forgive my ignorance is an interpolation the same as a continuous function in Mathcad i.e. can you do numerical integration on such a thing?
Mark
- Mark as New
- Bookmark
- Subscribe
- Mute
- Subscribe to RSS Feed
- Permalink
- Notify Moderator
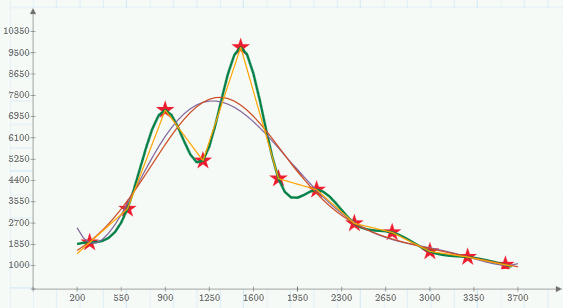
I also tried a polynomial fit and also a fit with two gaussians which both look very similar and good if the goal is a smooth curve. Ofcourse they are far away from those ouliers(if they are?) and I guess you would need more data points to decide which are outliers or not. A fit using a special function like logarithms, exponatial functions or combinations of them makes sense if you are searching the parameters of the underlying physics, but then you would have to provide the general form of the function derived from the physics.
As it seems that you just have the data and no more information about it I guess a polynomial fit or s spline interpolation (which runs exactly through all your datapoints) is as good as any.
Genfit() won't find the type of curve which fits best automatically but you will have to provide it, genfit() will only find the "optimal" parameters and very often is VERY sensible concerning the initial guess values you also have to provide. There are specialized programs which try to find the best type of function, one of them is "CurveExpert Professional". Not sure if they offer a trial version to download.
And yes, you can integrate and differentiate "functions" derived by interpolation routines - numerically only, of course.
See if the attached sheet helps. Think f1 is what you want to use but maybe you are even happy with linear interpolation (f0).

- Mark as New
- Bookmark
- Subscribe
- Mute
- Subscribe to RSS Feed
- Permalink
- Notify Moderator
I played around a bit with your data and found a sum of 6 Gaussians which fit pretty well.
I didn't use genfit() but minerr() as the results will be the same and with minerr() the whole thing is better managable. I used Mathcad 15 for this because that version is much more user friendly and and quicker reacting and converted the sheet later in P3 format - just in case you are wondering why the datavectors are defined in a different way.
You may play around with the number of summands and the guess value and i think you will get good fits with less summands, too. But you will notice that the fit is VERY sensible wrt the guess values (just change the top left 1010 in Matrix M to 1020 or to 1000 and see yourself).
I'm not sure but I guess you'll like the splined f1 in my last post more.
But as you wrote that the data is synthetic hydrograph I would imagine that the other two regressions in my previous post are describuig the event more realistic as they don't follow every peak and valley.

- Mark as New
- Bookmark
- Subscribe
- Mute
- Subscribe to RSS Feed
- Permalink
- Notify Moderator
Werner,
Thankyou very much it looks great. It seems that this was a good exercise as it reveled bugs and limitation of Mathcad Prime 3.0 I hope PTC are reading and fixing.
Kind regards, Mark
- Mark as New
- Bookmark
- Subscribe
- Mute
- Subscribe to RSS Feed
- Permalink
- Notify Moderator
Here are a view more regressions. They won't run through all your data points but provide a decent fit and look more like the graphs I saw on the net when searching for synthetic hydrograph. Anyway, its your choice now.

- Mark as New
- Bookmark
- Subscribe
- Mute
- Subscribe to RSS Feed
- Permalink
- Notify Moderator
Werner,
I am trying to keep up with this discussion, perhaps there are bugs perhaps there are future enhancements.
But you lost me .. how did you come up with g(t,v). I have not seen this fitting function .. I dont think
John
- Mark as New
- Bookmark
- Subscribe
- Mute
- Subscribe to RSS Feed
- Permalink
- Notify Moderator
I am trying to keep up with this discussion, perhaps there are bugs perhaps there are future enhancements.
You a referring to the thread I opened here http://communities.ptc.com/message/234933#234933 ? Not sure if I did something wrong there or not. But if not, then I would either expect a similar result as without units (at least if I use base units) or an error telling me, that regressions should not be done with units. I could image that there are reasons for better not using units here, but again I am not sure and so opened the discussion to collect other opinons.
But you lost me .. how did you come up with g(t,v). I have not seen this fitting function .. I dont think
I guess you have seen this fitting function already, but I sure should have better written it in a more convential way as the parameters would have a meaning if we do that and that can help to find guess values.
You are referring to
![]()
or in a later sheet
![]()
These are simply the sums of two or (the second) an arbitrary number of gaussians which are quite usual and useful functions to try for a fit in many situations. But I was surprised that I got that nearly perfect fit with 6 gaussians and also that slight changes in the guesses have that big impact on the result.
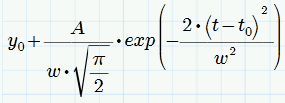
A gaussian is a function of the form
![]()
or may be written as

where y0 is the baseline offset, A is the total area under curve from the baseline, t0 is the center of the peak, w is something like 2 sigma, approximately 0.849 times the width of the peak at half height.
Richard had posted sums of gaussians from time to time in the past here and he uses
![]()
where h, w and t0 are controlling height, width and peak position.
The way of fitting multiple gaussians using the sum, matrix and minerr was stolen from Richard by me anyway.
I shouldn't had setup the function using meaningless coefficients, though.
- Mark as New
- Bookmark
- Subscribe
- Mute
- Subscribe to RSS Feed
- Permalink
- Notify Moderator
Thanks for the tutorial. I will ask Product Management if the stripping of the units is intentional or an oversight in regression. Thanks
- Mark as New
- Bookmark
- Subscribe
- Mute
- Subscribe to RSS Feed
- Permalink
- Notify Moderator
John T. Sheehan wrote:
Thanks for the tutorial. I will ask Product Management if the stripping of the units is intentional or an oversight in regression. Thanks
I could image that the problem is - stripping which units. The numerical algorithms use absolute values to decide if we have a convergence and if precision is good enough. That way it really matters if for volume Liters are stripped or m^3. So, should the algorithm strip the base (SI) units or the units the user is specifying when defining the data and guess values (are they still available?)? So question is if its possible to find a meaningful and intuitive way to deal with units here - am not sure about that. On the other hand it would be nice if a model would be refused right at the beginning because of obvious unit mismatch. E.g. let t be time and V volume as in the example in this thread. A model like g(t,v):=v[0 * ln(v[0 * t + v[1) would be refused because v[0 can't be volume and time^-1 at the same time.
And a built in standard regression like logfit() with the form a * ln(x + b) + c would not be possible at all with data with units, as x has to be assumed unitless here unless we provide an additonal coefficient for x (which we could normalize to 1/UnitOf(x)??). So it seems that allowing units in regressions would require some rewriting of predefined egressions as well.
- Mark as New
- Bookmark
- Subscribe
- Mute
- Subscribe to RSS Feed
- Permalink
- Notify Moderator
So unitless is the only way to do general purpose fits. OK , thanks
- Mark as New
- Bookmark
- Subscribe
- Mute
- Subscribe to RSS Feed
- Permalink
- Notify Moderator
Not exactly what I wanted to express. Units in regressions may help avoiding chosing a nonsuitable fit function because we immedeatly experience a unit mismatch. But implementation seems to be more work than just letting the regression algorithm strip units and adding them later. Also the predefined regressions like logfit would need a rework and maybe a redefinition. So prohibiting the use of units in regressions and throwing an error message if it is tried may only be a first step to avoid inconsistency. Implementing unit awareness to the routines sure need some deeper thought on how to do it.
- Mark as New
- Bookmark
- Subscribe
- Mute
- Subscribe to RSS Feed
- Permalink
- Notify Moderator
Ahh, ok got it ,thanks
- Mark as New
- Bookmark
- Subscribe
- Mute
- Subscribe to RSS Feed
- Permalink
- Notify Moderator
I could image that the problem is - stripping which units. The numerical algorithms use absolute values to decide if we have a convergence and if precision is good enough. That way it really matters if for volume Liters are stripped or m^3. So, should the algorithm strip the base (SI) units or the units the user is specifying when defining the data and guess values (are they still available?)? So question is if its possible to find a meaningful and intuitive way to deal with units here - am not sure about that.
The only solution would be to make CTOL handle units. Then if the data and fitting function have units and CTOL does not, you get an error message. Once CTOL is redefined using units, it would work.
- Mark as New
- Bookmark
- Subscribe
- Mute
- Subscribe to RSS Feed
- Permalink
- Notify Moderator
CTOL not TOL ?
- Mark as New
- Bookmark
- Subscribe
- Mute
- Subscribe to RSS Feed
- Permalink
- Notify Moderator
Actually, it's not clear from the help which applies to genfit. It should be CTOL though, because the tolerance is compared to the residuals between a function and data (i.e. known values), the same as a solve block.
Another solution would be to make CTOL and TOL relative tolerances, rather than absolute. IMO that's the way they should have been implemented way back when they were first implemented, because then they are independent of the magnitude of the data. Of course, the downside of this approach would be a lack of backward compatibility. Maybe it would be possible with a new worksheet option though.
- Mark as New
- Bookmark
- Subscribe
- Mute
- Subscribe to RSS Feed
- Permalink
- Notify Moderator
The only solution would be to make CTOL handle units. Then if the data and fitting function have units and CTOL does not, you get an error message. Once CTOL is redefined using units, it would work.
Probably true, but sounds rather unpractical having to redefine CTOL (rather TOL) with the correct unit before any regression or solve block,...
Maybe TOL could default to the base unit of any dimension used and need only to be redefined if thats not applicable? But if I redefine TOL to 10^-4 mm, what happens if I afterward use it in a regressions dealing with liter? Does TOL still default to liter or will I get an error. Seems not to be that easy to implement.
- Mark as New
- Bookmark
- Subscribe
- Mute
- Subscribe to RSS Feed
- Permalink
- Notify Moderator
Probably true,
Actually, not true. Don't know why I said it in fact ![]()
The better solution is the one I proposed all of 12 minutes later in my next post! Make CTOL and TOL relative, rather than absolute. Not only does that fix the unit issue, it makes them insensitive to the magnitude of the data, which is something that has tripped up many users. For backwards compatibility there would have to be a new worksheet option. I'm not a fan of lots of options because they tend to confuse people, but sometimes there is no better way of dealing with a problem.
- Mark as New
- Bookmark
- Subscribe
- Mute
- Subscribe to RSS Feed
- Permalink
- Notify Moderator
Making CTOL and TOL relative would sure be a good thing, but sometimes people want values precise to a specific number number of decimals and not to a specific number of digits. Using a worksheet option we wouldn't be able to mix both approches in one sheet.
BTW, do you think the differences I have shown in that sheet http://communities.ptc.com/message/234933#234933 are just because of a different/wrong interpretation of the TOL/CTOL values?
- Mark as New
- Bookmark
- Subscribe
- Mute
- Subscribe to RSS Feed
- Permalink
- Notify Moderator
See my reply in that thread.
- Mark as New
- Bookmark
- Subscribe
- Mute
- Subscribe to RSS Feed
- Permalink
- Notify Moderator
But I was surprised that I got that nearly perfect fit with 6 gaussians and also that slight changes in the guesses have that big impact on the result.
Neiter one surprises me. With 6 Gaussians you have 18 parameters, but you have only 12 data points,
Richard had posted sums of gaussians from time to time in the past here and he uses where h, w and t0 are controlling height, width and peak position.
It depends on what I want. The w in that expression is the full width at half height, which sometimes is more useful than the standard deviation.
- Mark as New
- Bookmark
- Subscribe
- Mute
- Subscribe to RSS Feed
- Permalink
- Notify Moderator
Richard Jackson wrote:
But I was surprised that I got that nearly perfect fit with 6 gaussians and also that slight changes in the guesses have that big impact on the result.
Neiter one surprises me. With 6 Gaussians you have 18 parameters, but you have only 12 data points,
Oh my god, you are perfectly right. Where did I had my head?!
- Mark as New
- Bookmark
- Subscribe
- Mute
- Subscribe to RSS Feed
- Permalink
- Notify Moderator
You can spline through the points and integrate the spline (your choice of pspline, cspline, etc.) If you know what the funcyion should be genfit (and Minerr) can find coefficients by least squares.
There is a public domain version of curveExpert, it may find a fit you didn't know about. Genfit requires you to specify the form of the function.


