
Turn on suggestions
Auto-suggest helps you quickly narrow down your search results by suggesting possible matches as you type.
Showing results for
Please log in to access translation
Turn on suggestions
Auto-suggest helps you quickly narrow down your search results by suggesting possible matches as you type.
Showing results for
- Community
- Creo+ and Creo Parametric
- Customization
- Re: J-Link debugging
Translate the entire conversation x
Please log in to access translation
Options
- Subscribe to RSS Feed
- Mark Topic as New
- Mark Topic as Read
- Float this Topic for Current User
- Bookmark
- Subscribe
- Mute
- Printer Friendly Page
J-Link debugging
Jan 06, 2011
02:15 AM
- Mark as New
- Bookmark
- Subscribe
- Mute
- Subscribe to RSS Feed
- Permalink
- Notify Moderator
Please log in to access translation
Jan 06, 2011
02:15 AM
J-Link debugging
I'm starting with synchronous J-Link application. I'm able to link & launch the sample applications, but not able to debug.
The J-Link documentation does not explain much about it. Even on web, I see posts suggesting about debug messages, but that it not very efficient way.
Any recommendations on the IDE to use and how to attach the debugger for the same?
Labels:
- Labels:
-
Jlink
14 REPLIES 14
Jan 11, 2011
10:28 AM
- Mark as New
- Bookmark
- Subscribe
- Mute
- Subscribe to RSS Feed
- Permalink
- Notify Moderator
Please log in to access translation
Jan 11, 2011
10:58 AM
- Mark as New
- Bookmark
- Subscribe
- Mute
- Subscribe to RSS Feed
- Permalink
- Notify Moderator
Please log in to access translation
Jan 11, 2011
10:58 AM
I use NetBeans for my IDE. You can attach a debugger to your appliction in sync mode.
Here is the config.pro option to attach a debugger.
jlink_java_command C:\proapps\proeWildfire_4.0\x86e_win64\obj\JRE\bin\java.exe -Xdebug -Xnoagent -Xrunjdwp:transport=dt_socket,address=8000,server=y,suspend=n
Then in Netbeans you go to Debug - Attach Debugger
I'm assuming you can probably do the same in Eclipse as well.
Jan 11, 2011
11:26 AM
- Mark as New
- Bookmark
- Subscribe
- Mute
- Subscribe to RSS Feed
- Permalink
- Notify Moderator
Please log in to access translation
Jan 11, 2011
11:26 AM
Apart from using a debugger, I sometime write to the system.out stream when catching exceptions in a J-Link program.
Because you do not have acces to system.out from the console, the method I used is changing the Pro/E startup command to:
%PROE_LOADPOINT%/proe.exe > C:\temp\output.txt
(On Microsoft Windows)
Everytime you write to the system.out stream from within your jlink application, this is written to the output.txt file.
This can be useful for performing some quick logging.
Jul 14, 2011
05:42 PM
- Mark as New
- Bookmark
- Subscribe
- Mute
- Subscribe to RSS Feed
- Permalink
- Notify Moderator
Please log in to access translation
Jul 14, 2011
05:42 PM
Debugging a Synchronous JLink Application using Eclipse
Description:
This document explains how to attach the debugger to a synchronous application using the Eclipse EE.
Setting the Config.pro Option
First you will need to set the config.pro option named “jlink_java_command” to point to the Pro/ENGINEER Wildfire version java.exe in the config.pro file. The option value is shown below.
For 32 Bit Systems:
jlink_java_command
C:\ptc\proeWildfire5\i486_nt\obj\JRE\bin\java.exe –Xdebug –Xnoagent
-Xrunjdwp:transport=dt_socket,address=8000,server=y,suspend=n
For 64 Bit Systems:
jlink_java_command
C:\ptc\proeWildfire5\ x86e_win64\obj\JRE\bin\java.exe -Xdebug
-Xrunjdwp:transport=dt_socket,address=8000,server=y,suspend=n
Note:
It is best to edit the config.pro file inside a Pro/ENGINEER session.
Setting an Eclipse Debug Configuration
You will need to setup a “Remote Java Application” debugger configuration in the Eclipse environment in order to attach the JLink synchronous application.
Select the debug icon > Debug Configurations in the Eclipse IDE Toolbar.
Double click on the Remote Java Application > Select Project > Select Apply.
Make sure that the Port number is the same as listed in the config.pro option.
Start Pro/ENGINEER with the protk.dat file registered. Select the Debug button for the Remote Java Application. The synchronous application must be running first before the Remote Java Application is executed otherwise Eclipse will throw an error. Once the Remote Java Application is running then you should see the remote connection icon in the debug tab, as shown below.
The last step is to execute the Synchronous Application in the Pro/ENGINEER session. You will see that it will go to the first break point in the Eclipse IDE.
Mar 26, 2013
08:13 AM
- Mark as New
- Bookmark
- Subscribe
- Mute
- Subscribe to RSS Feed
- Permalink
- Notify Moderator
Please log in to access translation
Mar 26, 2013
08:13 AM
Hello mister Felkins
i have tried step by step to reproduce your steps to start debugging, but no success.
when i use the jlink_java_command like you typed, i can't start any jlink application in my ProE (WF4).
and Eclipse tells the Connection is Refused...
Greetings,
Arno
Aug 05, 2014
03:38 AM
- Mark as New
- Bookmark
- Subscribe
- Mute
- Subscribe to RSS Feed
- Permalink
- Notify Moderator
Please log in to access translation
Aug 05, 2014
03:38 AM
JD, your solution works fine!, i can change the code on fly as well [add/change code, save file, renbuild project].
One thing i like to add is that your comment "For 64 Bit Systems:jlink_java_command C:\ptc\proeWildfire5\ x86e_win64\obj\......" contains a white space in the path for java.exe, and thats why some of us were not able to get the results.
Thanks
Vivek
Mar 23, 2018
07:17 AM
- Mark as New
- Bookmark
- Subscribe
- Mute
- Subscribe to RSS Feed
- Permalink
- Notify Moderator
Please log in to access translation
Mar 23, 2018
07:17 AM
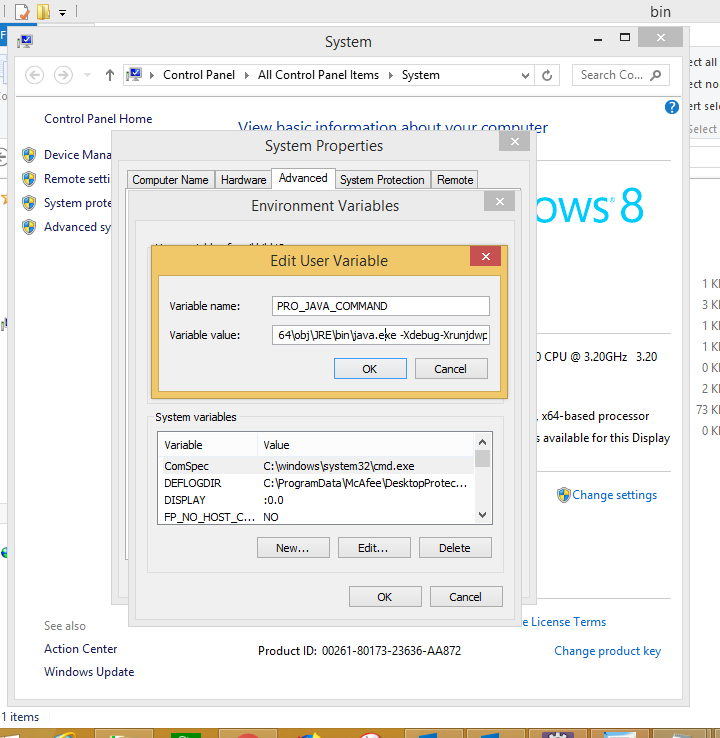
Hi,
I am facing issue in Remote VM.
Please find attached snap of config file and other files.
Aug 25, 2018
06:31 AM
- Mark as New
- Bookmark
- Subscribe
- Mute
- Subscribe to RSS Feed
- Permalink
- Notify Moderator
Please log in to access translation
Aug 25, 2018
06:31 AM
Which Creo version you are using Nikhil?
Feb 13, 2020
05:14 PM
- Mark as New
- Bookmark
- Subscribe
- Mute
- Subscribe to RSS Feed
- Permalink
- Notify Moderator
Please log in to access translation
Feb 13, 2020
05:14 PM
I'm trying with Creo 4.0 M150 with no success.
Nov 27, 2014
03:24 AM
- Mark as New
- Bookmark
- Subscribe
- Mute
- Subscribe to RSS Feed
- Permalink
- Notify Moderator
Please log in to access translation
Nov 27, 2014
03:24 AM
Hi Felkins,
Thanks for the setup steps. It helped my a lot.
Could anybody help me to understand where are the system.out messages logged?
or
is there a way to log system.out messages?
Mar 23, 2018
04:34 AM
- Mark as New
- Bookmark
- Subscribe
- Mute
- Subscribe to RSS Feed
- Permalink
- Notify Moderator
Please log in to access translation
Mar 23, 2018
04:34 AM
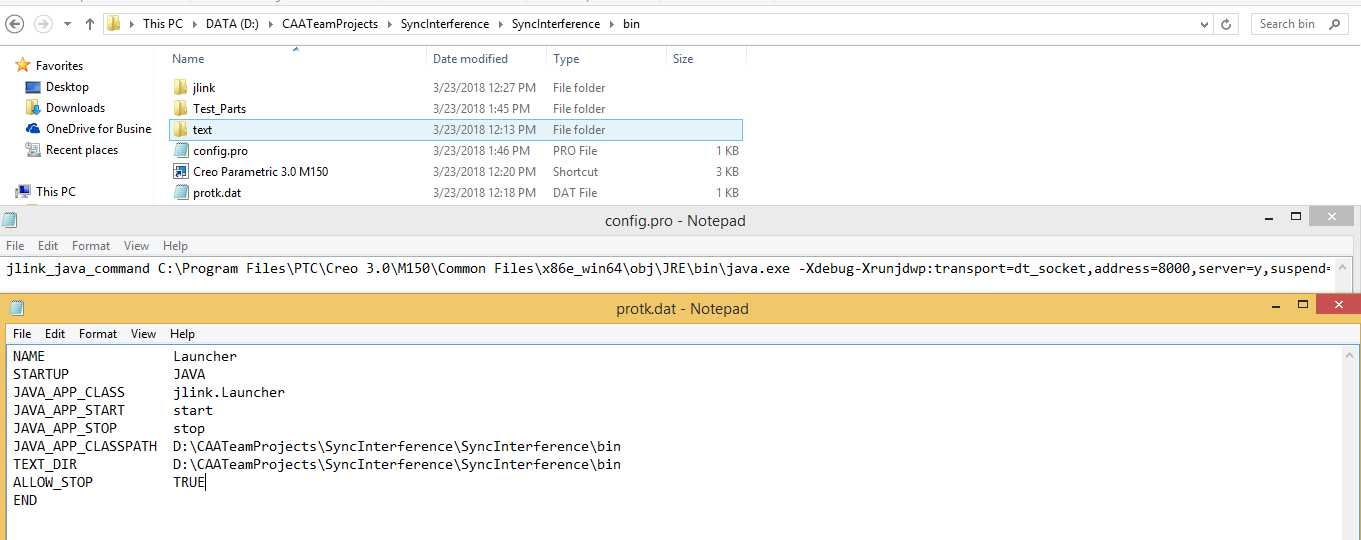
Hi,
I have did same settings,still facing remote VM connection refuse error.
Here i attached snap for the same.
Please help and needful.
Mar 03, 2021
02:43 PM
- Mark as New
- Bookmark
- Subscribe
- Mute
- Subscribe to RSS Feed
- Permalink
- Notify Moderator
Please log in to access translation
Mar 03, 2021
02:43 PM
I am also getting same error. I tried above mentioned all settings.
but it didn't work.
Please help if any one have any idea on above error message
Aug 05, 2021
12:06 PM
- Mark as New
- Bookmark
- Subscribe
- Mute
- Subscribe to RSS Feed
- Permalink
- Notify Moderator
Please log in to access translation
Aug 05, 2021
12:06 PM
This does work. I was having issues that others are seeing with port 8000. I switched it to a different port that was open, and it works well. @ptc-4392950 @Nikhil_KPIT @barneybence @vikaskumar try changing the port to see if you're able to get it working.
Mar 10, 2021
03:15 AM
- Mark as New
- Bookmark
- Subscribe
- Mute
- Subscribe to RSS Feed
- Permalink
- Notify Moderator
Please log in to access translation
Mar 10, 2021
03:15 AM
You have several options:
1. remote debugger (explained in @jkent reply)
2. use System.out.println() and setOut() to file - this will setOut for all jlink applications
3. use Logging framework eg http://logback.qos.ch/ .. note you have to put classpath dir to protk.dat classpath of logconfig file
Announcements


Top Tags
