Application Development Tips & Tricks Part 2
- October 17, 2022
- 0 replies
- 1012 views
- Step 3: Test Services and Save Test Cases
- Step 4: Utilize Code Auto-Complete Feature
- Step 5: Test Code at Design Time with Linting
- Step 6: Next Steps
Step 3: Test Services and Save Test Cases
In the previous step, you created an Entity with a customized Service. You can easily test and update the Service within the same editing window. This allows you to quickly modify a Service and confirm that its new behavior is functioning as expected.
Test Execution
To execute a Service, you can do it while still developing and after you have created it.
During Development
- Open the LineCheckSystem Thing.
- Select the Services tab.
- Click the ListHotLineParts link.

If you scroll to the bottom of the page, you will see the Execute window. Enter a value for the TemperatureThreshold and click Execute.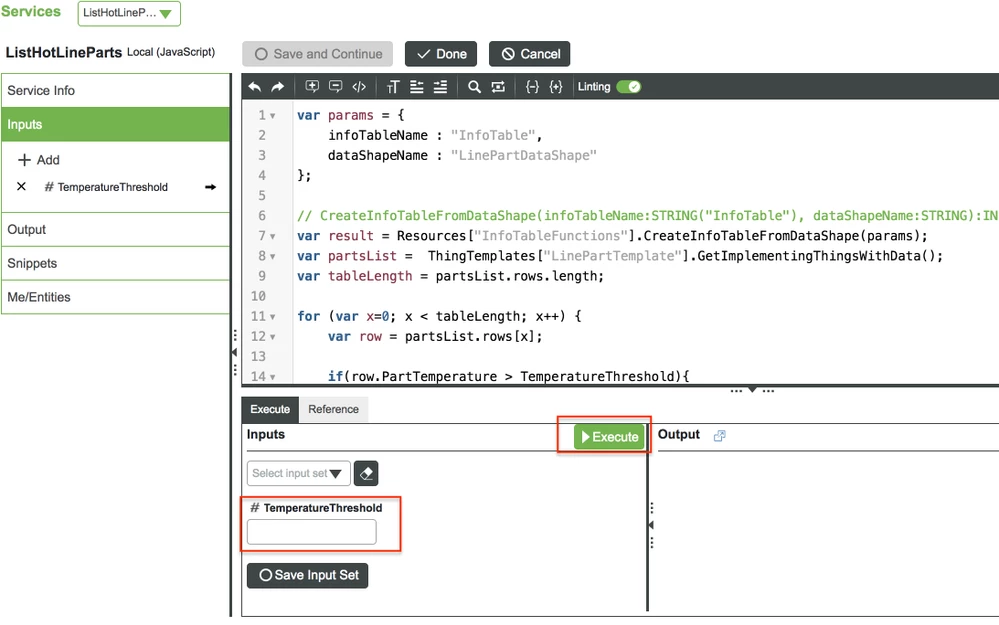
After Development
- Open the LineCheckSystem Thing.
- Select the Services tab.
Click the ListHotLineParts Execute play button.

- Enter a value for the TemperatureThreshold and click Execute.
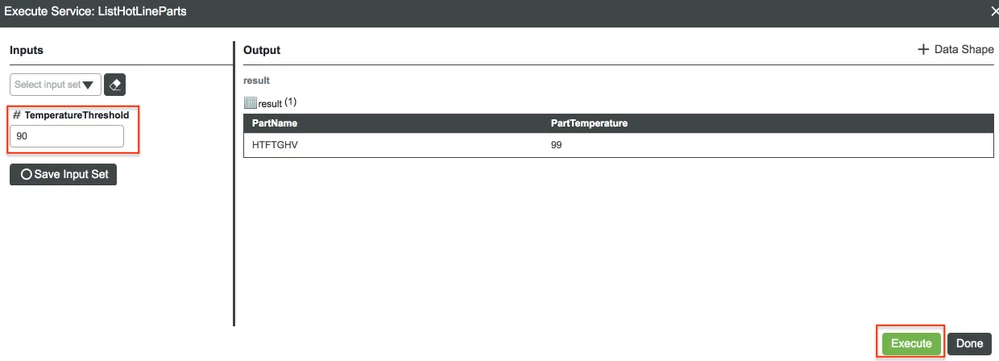
Saving Test Cases
Store input parameters makes testing during development and after development much faster. Whether you are testing base cases, specific scenarios, or throwing everything you possibly can at your Service, this tab will allow you to store and name test cases for later usage.
During Development
- Open the LineCheckSystem Thing.
- Select the Services tab.
- Click the ListHotLineParts link

If you scroll to the bottom of the page, you will see the Execute window. Enter a value for the TemperatureThreshold and click Save Input Set.
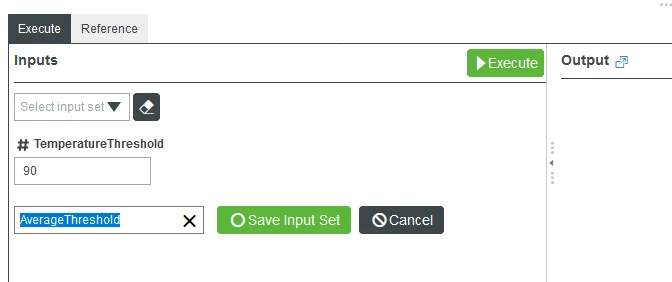
- When prompted, enter a name for this test case and click Save Input Set.
After Development
- Open the LineCheckSystem Thing.
- Select the Services tab.
Click the ListHotLineParts Execute play button.

- Enter a value for the TemperatureThreshold and click Save Input Set.
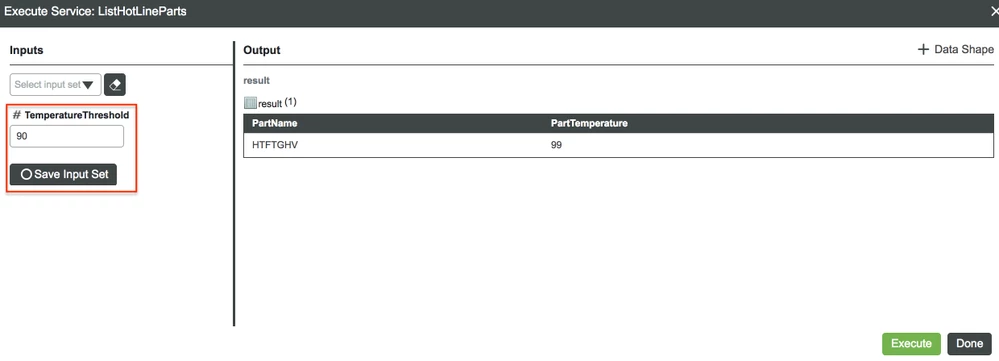
- When prompted, enter a name for this test case and click Save Input Set.
While this example is pretty simple and straightforward, it is also possible to store other values and other data types! You will be provided with a dropdown of your stored test cases. Just select a case and click Execute.
Step 4: Utilize Code Auto-Complete Feature
- If it is not open already, open the ListHotLineParts Service or create a new one.
- On a new line, enter ThingTemplates["LinePartTemplate"].
- Add a period . after the closing bracket to gain access to the Services and Properties of the Thing Template we created earlier.

You will now see the Services and Properties that were created inside of the LinePartTemplate or passed down in its object-oriented model.
Step 5: Test Code at Design Time with Linting
Linting is a process by which your development environment warns you of possible issues even before any attempt to run or test the code. Instead, an in-editor warning pops up that alerts you to the issue as you’re writing your code. Linting is yet another feature which many IDEs provide outside of the IoT realm.
Select the Lint checkbox at the top of the Service-editing section.
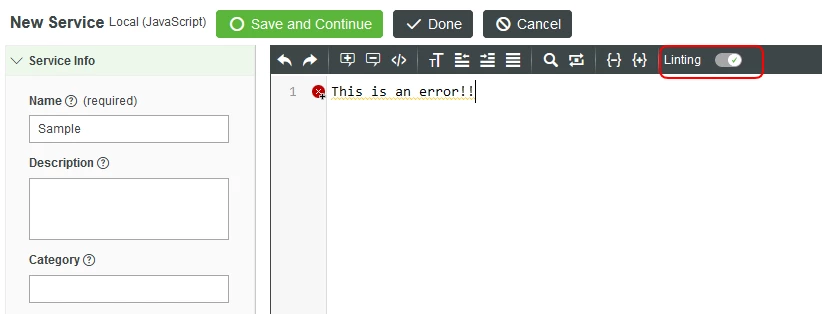
- Type any statement that would cause a Lint warning or error to pop up. In this case, it is best programming practice to use a semi-colons at the end of JavaScript code.
Debugging
Services within the composer are based on the Rhino JavaScript engine, which is built using Java.
It is currently unavailable to see the JavaScript code running within the browser, but you are able to still log what is occurring at each step of development and runtime. ThingWorx provides logging that will go to the ScriptLog under the Monitor section on the left. The logger uses different log levels that will appear differently in the ScriptLog screen.
| Level | Syntax | Example |
| info | logger.info | logger.info("X + 1 = " + 5); |
| trace | logger.trace | logger.trace("Print this InfoTable - " + table.toJSON()); |
| warning | logger.warn | logger.warn("Print random JSON data - " + JSON.stringify(data)); |
| debug | logger.debug | logger.debug("Adding debug information here."); |
| error | logger.error | logger.error("What kind of error took place? " + err.message); |
Testing Tips
From the Lint website, here are some common mistakes that JavaScript Lint looks for:
- Missing semicolons at the end of a line.
- Curly braces without an if, for, while, etc.
- Code that is never run because of a return, throw, continue, or break.
- Case statements in a switch that do not have a break statement.
- Leading and trailing decimal points on a number.
- A leading zero that turns a number into octal (base 8).
- Comments within comments.
- Ambiguity whether two adjacent lines are part of the same statement.
- Statements that don't do anything.
JavaScript Lint also looks for the following less common mistakes:
- Regular expressions that are not preceded by a left parenthesis, assignment, colon, or comma.
- Statements that are separated by commas instead of semicolons.
- Use of increment (++) and decrement (--) except for simple statements such as "i++;" or "--i;".
- Use of the void type.
- Successive plus (e.g. x+++y) or minus (e.g. x---y) signs.
- Use of labeled for and while loops.
- if, for, while, etc. without curly braces. (This check is disabled by default.)
Step 6: Next Steps
Congratulations! You've successfully completed the Application Development Tools, Tips & Tricks, and learned how to:
- Use Snippets to generate code
- Execute and test Services
- Save Service test cases to facilitate QA process
- Utilize the code auto-completion feature
- Test code at design time with Lint warnings and errors
Learn More
We recommend the following resources to continue your learning experience:
| Capability | Guide |
| Build | Create Custom Business Logic Guide |
| Experience | Create Your Application UI |
Additional Resources
If you have questions, issues, or need additional information, refer to:
| Resource | Link |
| Community | Developer Community Forum |
| Support | Help Center |

