Community Tip - You can change your system assigned username to something more personal in your community settings. X
- Subscribe to RSS Feed
- Mark Topic as New
- Mark Topic as Read
- Float this Topic for Current User
- Bookmark
- Subscribe
- Mute
- Printer Friendly Page
2D plotting a single value...?
- Mark as New
- Bookmark
- Subscribe
- Mute
- Subscribe to RSS Feed
- Permalink
- Notify Moderator
2D plotting a single value...?
Hello everybody,
I have a very simple question: is it possible to add a point in a 2D plot as a single value representation, along with other function graphs? I mean, for example, I have a force diagram of a traction spring (a line) and I want to add a point of this diagram which will show the current parameters of the spring (force vs. dx). If I just add the current value of the force to the "y" axis of the diagram, I will get a horizontal line for that value... It has to be a simple way to represent just the point... but how?
Thanks in advance for your answers!
Conrad
- Labels:
-
Other
- Mark as New
- Bookmark
- Subscribe
- Mute
- Subscribe to RSS Feed
- Permalink
- Notify Moderator
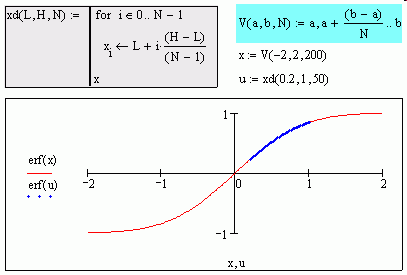
You can add markers on the x and y axis of graphs. you can also plot points. Have a look at the attached image.
Post a worksheet of the example.
Mike
- Mark as New
- Bookmark
- Subscribe
- Mute
- Subscribe to RSS Feed
- Permalink
- Notify Moderator
I know I can use markers and that I can change the symbols for a graph, what I want is to have a graphical representation of a [a, f(a)] point, What I'm getting now is a diagram of f(a) over the whole x range (so a horizontal line, cause I have a single value for f(a)), meaning something like [x, f(a)]...
Basically, I want to get 2 single points instead of the 2 blue horizontal lines (please see attached picture).
- Mark as New
- Bookmark
- Subscribe
- Mute
- Subscribe to RSS Feed
- Permalink
- Notify Moderator
- Mark as New
- Bookmark
- Subscribe
- Mute
- Subscribe to RSS Feed
- Permalink
- Notify Moderator
Exactly. Do I have to use vector, as in your example?
- Mark as New
- Bookmark
- Subscribe
- Mute
- Subscribe to RSS Feed
- Permalink
- Notify Moderator
Reply posted by Richard to my problem yesterday.
You don't need to. You could generate 2 matrices, one for X and one for Y. Or you can generate one matrix, with the X coordinates stored in the real part and the Y coordinates stored in the imaginary part. I personally prefer the one matrix approach because keeps all the coordinates in one place.
Mike
- Mark as New
- Bookmark
- Subscribe
- Mute
- Subscribe to RSS Feed
- Permalink
- Notify Moderator
If you are still struggling with the problem post a worksheet.
Mike
- Mark as New
- Bookmark
- Subscribe
- Mute
- Subscribe to RSS Feed
- Permalink
- Notify Moderator
It's ok, I've got it now.
Thank you!
- Mark as New
- Bookmark
- Subscribe
- Mute
- Subscribe to RSS Feed
- Permalink
- Notify Moderator
Costel Paiusi wrote:
It's ok, I've got it now.
Thank you!
Costel,
For completness and to aid other collabs with similar problems a worksheet or image should be provided with the solution.
Easier to follow steps in a worksheet than posts in hear.
Mike
- Mark as New
- Bookmark
- Subscribe
- Mute
- Subscribe to RSS Feed
- Permalink
- Notify Moderator
...

jmG


