
Turn on suggestions
Auto-suggest helps you quickly narrow down your search results by suggesting possible matches as you type.
Showing results for
Please log in to access translation
Turn on suggestions
Auto-suggest helps you quickly narrow down your search results by suggesting possible matches as you type.
Showing results for
Community Tip - Did you know you can set a signature that will be added to all your posts? Set it here! X
Translate the entire conversation x
Please log in to access translation
Options
- Subscribe to RSS Feed
- Mark Topic as New
- Mark Topic as Read
- Float this Topic for Current User
- Bookmark
- Subscribe
- Mute
- Printer Friendly Page
2d interpolation
Jun 19, 2017
11:23 AM
- Mark as New
- Bookmark
- Subscribe
- Mute
- Subscribe to RSS Feed
- Permalink
- Notify Moderator
Please log in to access translation
Jun 19, 2017
11:23 AM
2d interpolation
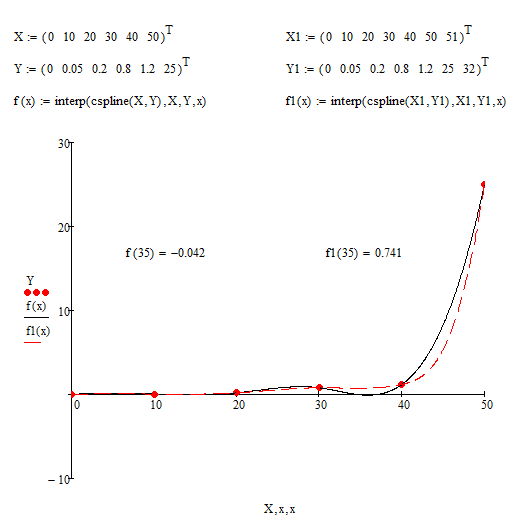
Dear all,
I'm facing an issue with 2d interpolation in Mathcad.
The interpolating function results in negative, not plausible values.
Could you please support you?
Attached you find the file.
Thank-you very much.
Enrico
Solved! Go to Solution.
ACCEPTED SOLUTION
Accepted Solutions
Jun 19, 2017
12:54 PM
- Mark as New
- Bookmark
- Subscribe
- Mute
- Subscribe to RSS Feed
- Permalink
- Notify Moderator
Please log in to access translation
Jun 19, 2017
12:54 PM
Tried a simple linear interpolation, put the Y scale logarithmic, saw the problem.
Try attached
11 REPLIES 11
Jun 19, 2017
12:12 PM
- Mark as New
- Bookmark
- Subscribe
- Mute
- Subscribe to RSS Feed
- Permalink
- Notify Moderator
Please log in to access translation
Jun 19, 2017
12:12 PM
See please the pics 1.1-1.4 here
Jun 19, 2017
12:32 PM
- Mark as New
- Bookmark
- Subscribe
- Mute
- Subscribe to RSS Feed
- Permalink
- Notify Moderator
Please log in to access translation
Jun 19, 2017
12:32 PM
Hello Valery,
Thank you for answering. However I didn't get where is the problem by the definition of the two-dimensional spline function.
Do you have any Idea?
Thanks!
Enrico
Jun 19, 2017
12:54 PM
- Mark as New
- Bookmark
- Subscribe
- Mute
- Subscribe to RSS Feed
- Permalink
- Notify Moderator
Please log in to access translation
Jun 19, 2017
12:54 PM
Tried a simple linear interpolation, put the Y scale logarithmic, saw the problem.
Try attached
Jul 24, 2017
02:16 AM
- Mark as New
- Bookmark
- Subscribe
- Mute
- Subscribe to RSS Feed
- Permalink
- Notify Moderator
Please log in to access translation
Jul 24, 2017
02:16 AM
Thank-you all for your precious support!
Jun 19, 2017
04:26 PM
- Mark as New
- Bookmark
- Subscribe
- Mute
- Subscribe to RSS Feed
- Permalink
- Notify Moderator
Please log in to access translation
Jun 19, 2017
04:26 PM
I understand your problem.
Among the functions lspline, pspline, cspline, there is no function by which the value of the first derivative of a function on the boundary could be specified.
To solve your problem it is necessary to add boundary conditions (imaginary conditions).
Look at the small example for a function of one variable.
Я понимаю вашу проблему.
Среди функций lspline, pspline, cspline нет функции, с помощью которой можно было бы задать значение первой производной функции на границе.
Для решения вашей задачи необходимо добавить граничные условия (мнимые условия).
Посмотрите маленький пример для функции одной переменной.
Jun 19, 2017
07:25 PM
- Mark as New
- Bookmark
- Subscribe
- Mute
- Subscribe to RSS Feed
- Permalink
- Notify Moderator
Please log in to access translation
Jun 19, 2017
07:25 PM
Splines tend to oscillate, so its no surprise you also get negative values in your interpolation - especially given the wide range of your "Properties" values.
Its interesting to see that Freds interesting tricky way works and gives positive values.
I would stick with a simple 2D linear interpolation.
As Mathcads 2D interpolations restricts me to a square data matrix I had written a few 2D (and 3D) interpolation routines which do not have that restriction. See attached file

Here is the 3D-plot using Freds function
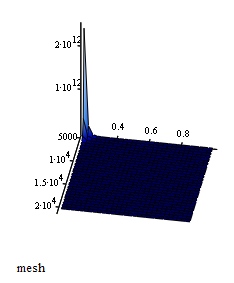
Maybe his function is more appropriate for your purpose - you'll have to decide.
Jun 20, 2017
03:15 AM
- Mark as New
- Bookmark
- Subscribe
- Mute
- Subscribe to RSS Feed
- Permalink
- Notify Moderator
Please log in to access translation
Jun 20, 2017
03:15 AM
Dear Werner, could it be that you have attached an older version of your file? When I open it with MC 15.045 I see this:
As you can see there are some strange issues in both plots.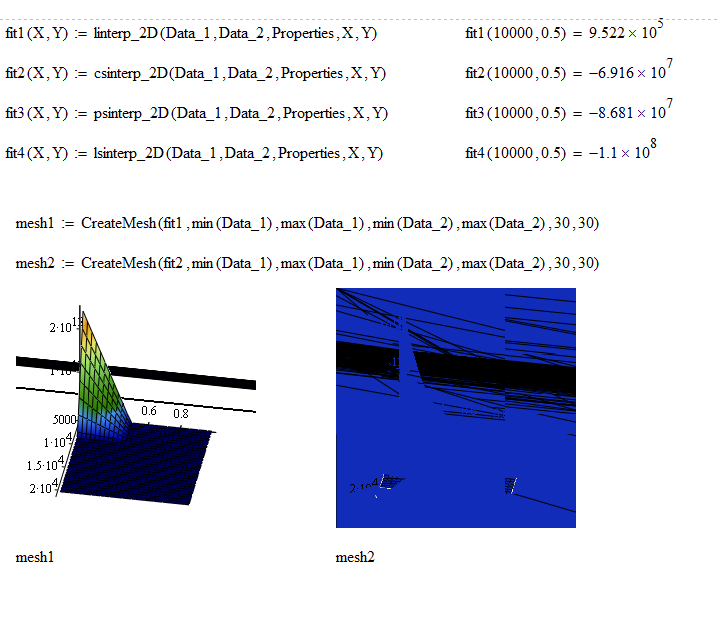
Jun 20, 2017
03:26 AM
- Mark as New
- Bookmark
- Subscribe
- Mute
- Subscribe to RSS Feed
- Permalink
- Notify Moderator
Please log in to access translation
Jun 20, 2017
03:26 AM
No, its saved with MC15 M045.
But 3D-plots are lknown to be problematic depending on OS, video driver, setting of color depth and graphics acceleration.
Not sure why you see those distorted plots.
Jun 20, 2017
04:54 AM
- Mark as New
- Bookmark
- Subscribe
- Mute
- Subscribe to RSS Feed
- Permalink
- Notify Moderator
Please log in to access translation
Jun 20, 2017
04:54 AM
Thank you for your prompt reply. What should be the most likely cause, or is it like searching for the needle in the hay stack?
Jun 20, 2017
06:01 AM
- Mark as New
- Bookmark
- Subscribe
- Mute
- Subscribe to RSS Feed
- Permalink
- Notify Moderator
Please log in to access translation
Jun 20, 2017
06:01 AM
The usual tipps when one experiences problems with 3D plots are
- turn off the border (which already is in my plots)
- reduce the color depth on your system
- turn off grahics acceleration
- install the newest driver for your video
But the problem usually is that 3Dplots do not show up completetly. Thats not the case here as you see the plots.
No clue what could be the cause. What happens if you create the plots yourself from scratch?
Did you experience problems with 3D plots before?
Jun 20, 2017
06:14 AM
- Mark as New
- Bookmark
- Subscribe
- Mute
- Subscribe to RSS Feed
- Permalink
- Notify Moderator
Please log in to access translation
Jun 20, 2017
06:14 AM
Reducing color depth from 32 bits to 16 bits gave a massive improvement (plot 2 OK, Plot 1 still a black bar). Recreating the plots from scratch did not change anything. When I change the plot to data points I get correct plots even without reducing color depth. I am afraid I will be forced to experiment a little bit further. Anyway, thank you for your valuable help (as usual). Filip


