Community Tip - Have a PTC product question you need answered fast? Chances are someone has asked it before. Learn about the community search. X
- Subscribe to RSS Feed
- Mark Topic as New
- Mark Topic as Read
- Float this Topic for Current User
- Bookmark
- Subscribe
- Mute
- Printer Friendly Page
3D Mathcad Plot does not work
- Mark as New
- Bookmark
- Subscribe
- Mute
- Subscribe to RSS Feed
- Permalink
- Notify Moderator
3D Mathcad Plot does not work
Hi
I hope someone here can help me!
I am trying to visualize a function with 2 independent variables like z(x,y) := .... but it does not work.
Everytime I generate a "Surface Diagram" / "Surface Plot" and say which function I want to get visualized, Mathcad says "The variable is not defined." to one of the two independents.
I look forward for some useful hints! ![]()
Greets
phil
Solved! Go to Solution.
- Labels:
-
Other
Accepted Solutions
- Mark as New
- Bookmark
- Subscribe
- Mute
- Subscribe to RSS Feed
- Permalink
- Notify Moderator
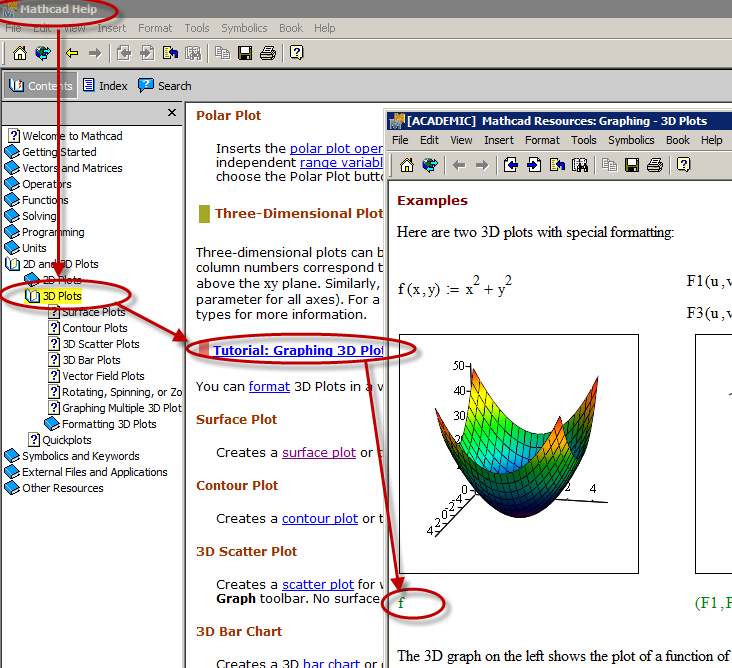
* 2. place name of function in the placeholder in the lower left corner
Thats the point! Just the name - no parentheses, no arguments!
What about the quicksheet I mentioned?

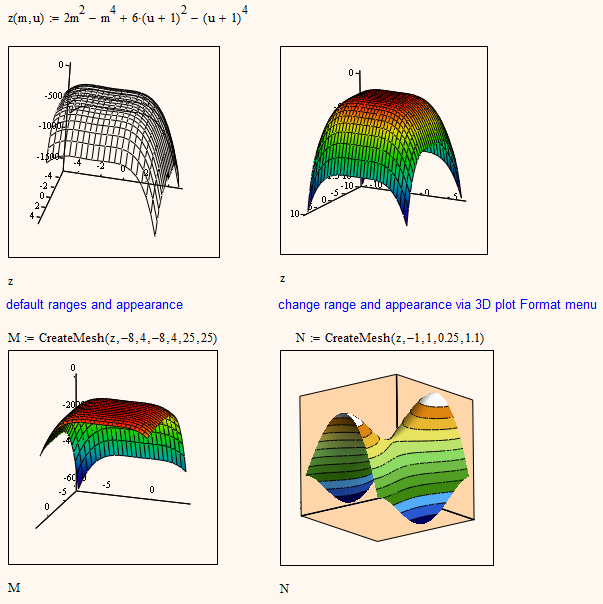
The help section about surface plots provides a link to the explanation of the CreateMesh() function just a few lines below the text you cited and again, if you follow that link and the information there is not clear enough, you are offered a link to the appropriate Quicksheet. This sheet deals mainly with parametric function but the syntax to use should be clear nonetheless with the information provided there.
Its the same in your German version as well. BTW, when using that German version you may encounter problems when using t as a quickplot variable or when dealing with Laplace transforms, as t will be interpreted as tonne and s as seconds. Thats very nasty and the only way out is to set (at least) the Math Language to English and its a good idea to switch the menu language as well.

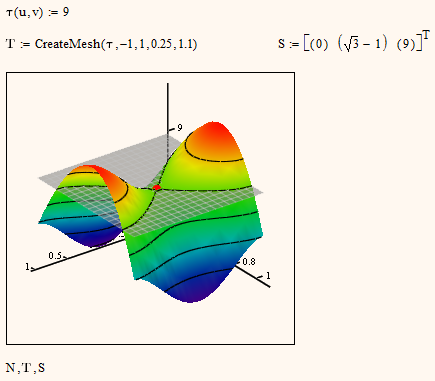
You may also add the saddle and its tangential plane

For future questions please state which version of Mathcad you are using and its also much better to attach a worksheet rather than just a picture.
And of course - read the help thoroughly ![]()
- Mark as New
- Bookmark
- Subscribe
- Mute
- Subscribe to RSS Feed
- Permalink
- Notify Moderator
I look forward for some useful hints!
Simply look it up in the help - what syntax did you lookup there for 3D plots?
Lookup surface plots and if the text isn't clear enough, follow the link to the quicksheets and look at the 3D plots tutorial. The very first example covers the syntax to use in your case.
Another way which gives you better control over the ranges of the two independent variables other than changing the quickplot data is the use of CreateMesh(), though.
- Mark as New
- Bookmark
- Subscribe
- Mute
- Subscribe to RSS Feed
- Permalink
- Notify Moderator
I looked up the help to create a 3D plot.
But every step described in the mathcad help for "3D Flächendiagramme" / "3D Plots" was done by myself:
* 0. Generate a function like mine (z(x,y) := 2x^2 - x^4 + 6(y+1)^2 - (y+1)^4)
* 1. [Strg]2 for a space for 3D Plots
* 2. place name of function in the placeholder in the lower left corner
* 3. click beside
-> Mathcad should generate the 3D plot now, but it complains about one of the two independents.
(When I use z(x,y) it complains about x and if I use z(m,y) it complains about y and so on...)
Have you seen my attached file?
There you can see that I accted exactly like described.
And when i click the 3D plot tutorial, there is nothing else new to see. :S
Can you explain what CreateMesh() should do, or how to use it?
- Mark as New
- Bookmark
- Subscribe
- Mute
- Subscribe to RSS Feed
- Permalink
- Notify Moderator
* 2. place name of function in the placeholder in the lower left corner
Thats the point! Just the name - no parentheses, no arguments!
What about the quicksheet I mentioned?

The help section about surface plots provides a link to the explanation of the CreateMesh() function just a few lines below the text you cited and again, if you follow that link and the information there is not clear enough, you are offered a link to the appropriate Quicksheet. This sheet deals mainly with parametric function but the syntax to use should be clear nonetheless with the information provided there.
Its the same in your German version as well. BTW, when using that German version you may encounter problems when using t as a quickplot variable or when dealing with Laplace transforms, as t will be interpreted as tonne and s as seconds. Thats very nasty and the only way out is to set (at least) the Math Language to English and its a good idea to switch the menu language as well.

You may also add the saddle and its tangential plane

For future questions please state which version of Mathcad you are using and its also much better to attach a worksheet rather than just a picture.
And of course - read the help thoroughly ![]()
- Mark as New
- Bookmark
- Subscribe
- Mute
- Subscribe to RSS Feed
- Permalink
- Notify Moderator
Thank you very much Werner Exinger!
Every problem solved.
I am sorry for my unprofessional acting.
(First time using this forum. ![]() )
)
Glad Greets,
Philipp
- Mark as New
- Bookmark
- Subscribe
- Mute
- Subscribe to RSS Feed
- Permalink
- Notify Moderator
I am sorry for my unprofessional acting.
(First time using this forum.)
No problem - welcome to this place!


