
Turn on suggestions
Auto-suggest helps you quickly narrow down your search results by suggesting possible matches as you type.
Showing results for
Please log in to access translation
Turn on suggestions
Auto-suggest helps you quickly narrow down your search results by suggesting possible matches as you type.
Showing results for
Community Tip - You can subscribe to a forum, label or individual post and receive email notifications when someone posts a new topic or reply. Learn more! X
Translate the entire conversation x
Please log in to access translation
Options
- Subscribe to RSS Feed
- Mark Topic as New
- Mark Topic as Read
- Float this Topic for Current User
- Bookmark
- Subscribe
- Mute
- Printer Friendly Page
3D data, surface plot & 3D plot fit.
Sep 30, 2011
03:30 PM
- Mark as New
- Bookmark
- Subscribe
- Mute
- Subscribe to RSS Feed
- Permalink
- Notify Moderator
Please log in to access translation
Sep 30, 2011
03:30 PM
3D data, surface plot & 3D plot fit.
I have a table of data x, y, z in excel.
1. What is the best way of importing this data into Mathcad 15 for further analysis?
(So far I used Insert->Component...)
2. How do you plot this data as a Surface Plot?
(Stuck here)
3. How do you produce a function that would characterize this data, similar to a curve fit? So knowing x and y, you can plug them into z=f(x,y) to get desired value. (Ultimately this is what needed. I have multiple data tables like this and need to charactarize them by a function)
Thank you in advance for taking your time to respond.
I searched for related topics here and online but no success so far.
Any help is appreciated.
Labels:
- Labels:
-
Statistics_Analysis
- Tags:
- 3d
- data
- regression
2 REPLIES 2
Oct 01, 2011
04:02 AM
- Mark as New
- Bookmark
- Subscribe
- Mute
- Subscribe to RSS Feed
- Permalink
- Notify Moderator
Please log in to access translation
Oct 01, 2011
04:02 AM
Vitaliy,
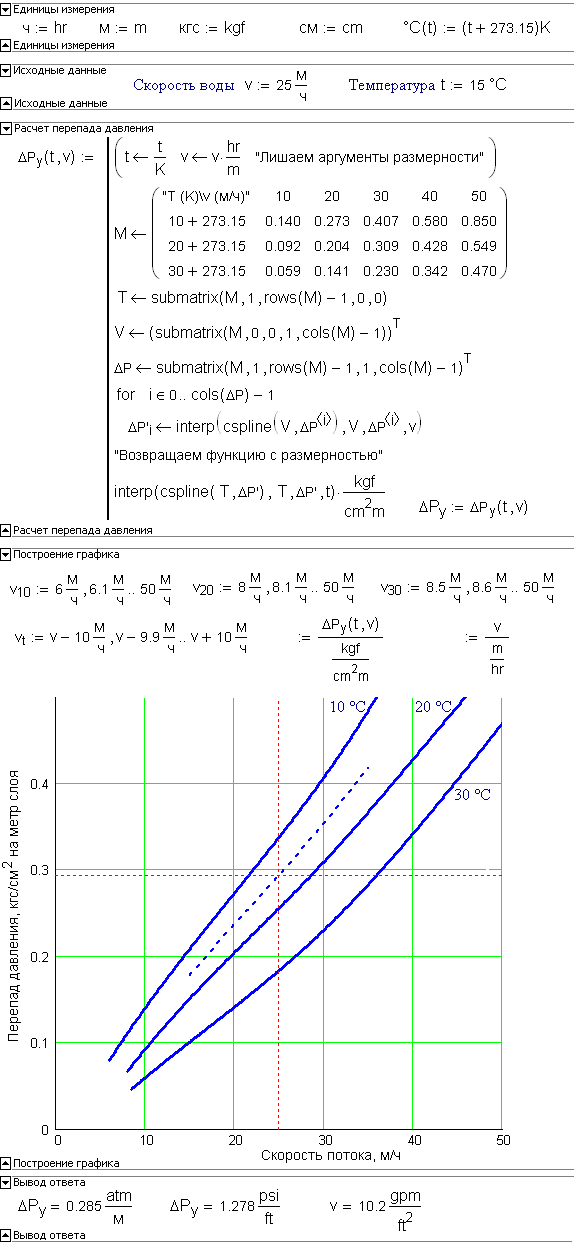
I have described this task in the 4-d chapter "Technical Statistic"of the book "Mathcad for students and engineers".
See for example this picture from the book:
http://twt.mpei.ac.ru/ochkov/Mathcad_12/4_03_3D_Spline.png
and others pictures here
Oct 01, 2011
07:50 AM
- Mark as New
- Bookmark
- Subscribe
- Mute
- Subscribe to RSS Feed
- Permalink
- Notify Moderator
Please log in to access translation
Oct 01, 2011
07:50 AM
Vitaliy Glotov wrote:
I have a table of data x, y, z in excel.
1. What is the best way of importing this data into Mathcad 15 for further analysis?
(So far I used Insert->Component...)
2. How do you plot this data as a Surface Plot?
(Stuck here)
3. How do you produce a function that would characterize this data, similar to a curve fit? So knowing x and y, you can plug them into z=f(x,y) to get desired value. (Ultimately this is what needed. I have multiple data tables like this and need to charactarize them by a function)
Thank you in advance for taking your time to respond.
I searched for related topics here and online but no success so far.
Any help is appreciated.
1) I prefer data tables; this puts the data into the mathcad sheet.
2) Help is hard to understand. Persist!
5) Multi-dimensional polynomial regression is available in the function "regress."


