Community Tip - You can Bookmark boards, posts or articles that you'd like to access again easily! X
- Subscribe to RSS Feed
- Mark Topic as New
- Mark Topic as Read
- Float this Topic for Current User
- Bookmark
- Subscribe
- Mute
- Printer Friendly Page
3D graphs
- Mark as New
- Bookmark
- Subscribe
- Mute
- Subscribe to RSS Feed
- Permalink
- Notify Moderator
3D graphs
I have just tried to get a surface plot for a small matrix in Mathcad 15. It will only show me it as a contour map or a vector field. I think this is the first time I;ve done this since upgrading from 14. So I loaded a file which I had created in 14 and had the same response. Is this a bug or a known problem ? Any advice please.
- Labels:
-
Other
- Tags:
- 3d_graphs
- mathcad_15
- Mark as New
- Bookmark
- Subscribe
- Mute
- Subscribe to RSS Feed
- Permalink
- Notify Moderator
Could you post the sheet?
- Mark as New
- Bookmark
- Subscribe
- Mute
- Subscribe to RSS Feed
- Permalink
- Notify Moderator
Thanks in advance. The sheet is attached, having cleared out some extraneous calcs. The problem graph is at the end.
- Mark as New
- Bookmark
- Subscribe
- Mute
- Subscribe to RSS Feed
- Permalink
- Notify Moderator
Robin,
I did not have any trouble, except because of the units, scaled the graph.
If you plot one 2D matrix, the Mathcad plots element i,j against x=i and y=j. So you can't add your own scale.
To plot correctly, you need to make a nested matrix of X, Y and Z values. There is an one to one correspondence,
Xi,j andYi,j and Zi,j. So you just need to expand the x and y matrices.
See attached.
- Mark as New
- Bookmark
- Subscribe
- Mute
- Subscribe to RSS Feed
- Permalink
- Notify Moderator
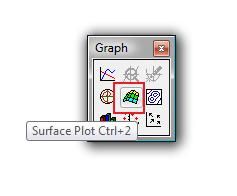
If you want to create a 3D surface, then you need to use "SurfacePlot" (or hotkey "Ctrl +2") from the toolbar "Graph".

P.S. You used "Contour Plot" in your Mathcad worksheet.
- Mark as New
- Bookmark
- Subscribe
- Mute
- Subscribe to RSS Feed
- Permalink
- Notify Moderator
- Mark as New
- Bookmark
- Subscribe
- Mute
- Subscribe to RSS Feed
- Permalink
- Notify Moderator
Thank you all for the comments, particularly how to scale the axes. The solution to getting a surface plot to appear I found from a previous thread which appeared in the list of associated items. It seems I have to turn off the border because I have an ATI graphics card. Obviously this is a new bug for 15 because I did not have the problem in 14. I am surprised it has not been fixed.
- Mark as New
- Bookmark
- Subscribe
- Mute
- Subscribe to RSS Feed
- Permalink
- Notify Moderator


