Community Tip - New to the community? Learn how to post a question and get help from PTC and industry experts! X
- Subscribe to RSS Feed
- Mark Topic as New
- Mark Topic as Read
- Float this Topic for Current User
- Bookmark
- Subscribe
- Mute
- Printer Friendly Page
Area integration
- Mark as New
- Bookmark
- Subscribe
- Mute
- Subscribe to RSS Feed
- Permalink
- Notify Moderator
Area integration
I have sets of measurement data, time (s), temperature and detector response.
At certain temperatures (or time) I get a detector response that forms one or two peaks.
I need to calculate the area of these peaks, how to do this?
- Labels:
-
Statistics_Analysis
- Mark as New
- Bookmark
- Subscribe
- Mute
- Subscribe to RSS Feed
- Permalink
- Notify Moderator
Upload a worksheet with your data and what you've tried so far (at least plot the data). By 'area of these peaks' do you mean when plotted as a function of time or of temperature?
Alan
- Mark as New
- Bookmark
- Subscribe
- Mute
- Subscribe to RSS Feed
- Permalink
- Notify Moderator
- Mark as New
- Bookmark
- Subscribe
- Mute
- Subscribe to RSS Feed
- Permalink
- Notify Moderator
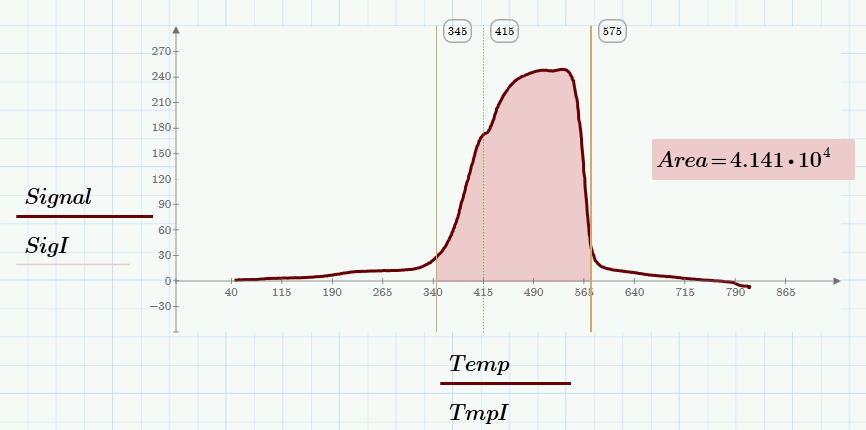
Somewhat wrong example because I usually get 2 peaks as can be seen by the small shoulder at 415 C.
What I need is the area under the curve between 340 and 570 degrees.
- Mark as New
- Bookmark
- Subscribe
- Mute
- Subscribe to RSS Feed
- Permalink
- Notify Moderator
Please attach your Mathcadsheet and don't post the Excel data as message body!!
You may consider deleting that post.
- Mark as New
- Bookmark
- Subscribe
- Mute
- Subscribe to RSS Feed
- Permalink
- Notify Moderator
- Mark as New
- Bookmark
- Subscribe
- Mute
- Subscribe to RSS Feed
- Permalink
- Notify Moderator
The data in this sheet is definitely different from the one you provided erlier which looked like this

and I was already confused with the Temp. values 340 and 415 you mentioned.
- Mark as New
- Bookmark
- Subscribe
- Mute
- Subscribe to RSS Feed
- Permalink
- Notify Moderator
Here is a routine which seems to do what you need.

An alternate approach woul have been to turn the table Temp/Signal into a function using some kind of interpolation (linear or spline). But to do so the vector Temp must consist of consecutive (sorted) values which is not the case in your sample data. So this problem would have to be addressed first by either sorting the vectors accordingly or cutting away the non sorted areas. The advantage with this approach would be that you could use the normal integral to get the area.
P.S.: Think you did a copy and paste to put the data values into this Prime table which seems not to be resizeable. I hide it in a collapsed region but wouldn't it be much more convenient (assuming you have more than one dataset to work on) to use an Excel component or simply READEXCEL() to get the data into the sheet?
EDIT: Appended second dataset via Excel component.


