Community Tip - If community subscription notifications are filling up your inbox you can set up a daily digest and get all your notifications in a single email. X
- Subscribe to RSS Feed
- Mark Topic as New
- Mark Topic as Read
- Float this Topic for Current User
- Bookmark
- Subscribe
- Mute
- Printer Friendly Page
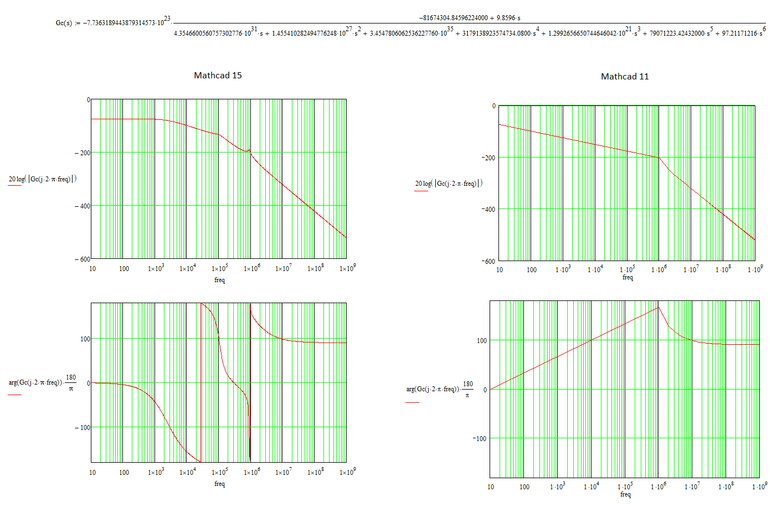
Bode Plot: Mathcad 15 vs Mathcad 11
- Mark as New
- Bookmark
- Subscribe
- Mute
- Subscribe to RSS Feed
- Permalink
- Notify Moderator
Bode Plot: Mathcad 15 vs Mathcad 11
- Labels:
-
Electrical_Engineering
-
Mathcad Usage
Accepted Solutions
- Mark as New
- Bookmark
- Subscribe
- Mute
- Subscribe to RSS Feed
- Permalink
- Notify Moderator
No, they should not.
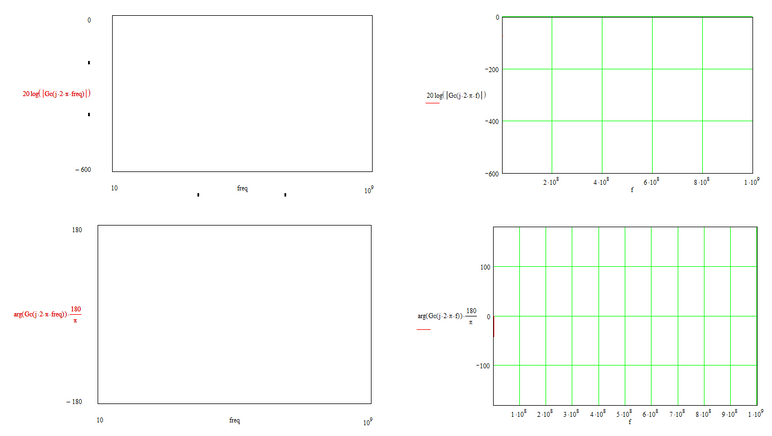
You did not define the variable 'freq'. This means that you left it to Mathcad to pick a suitable range for frequencies when you created the 'autoplot' (which is a nice feature, but as all features: to be handled with care).
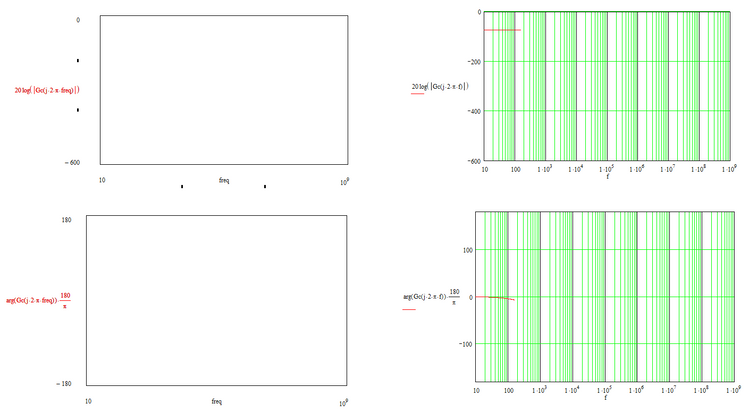
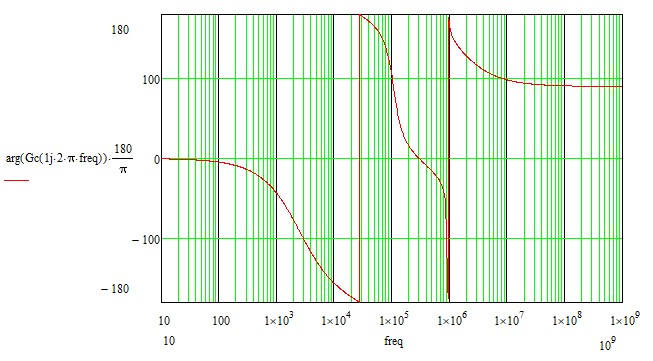
In the case of mathcad 11, it took a linear range, starting at 10 (maybe) and stepping to 10^9 with steps of 10^6. That is why there are no (additional) points in the range of freq between 10 and one million.
In the case of mathcad 15, it probably took a range of frequencies logarithmically spaced from 10 to 10^9 with maybe 20 points per decade.
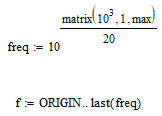
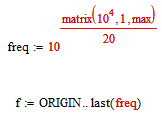
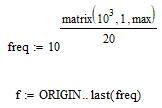
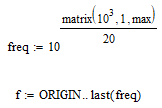
If you add this,
above the plot, tou your Mathcad 11 sheet, the you have defined freq as an array of frequencies, logarithmically spaced from 10 to 10^9 at 20 points per decade. And f is an index into that array.
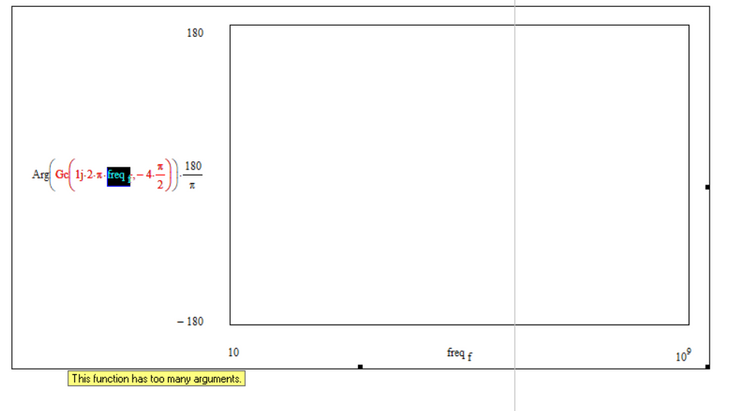
Now all there is left to be done is to handle freq as an array in your plots, so add [f at the end each occurrence of freq in your plots.
Note that in mathcad 15 a function logspace() is available that can create a similar array.
Success!
Luc
- Mark as New
- Bookmark
- Subscribe
- Mute
- Subscribe to RSS Feed
- Permalink
- Notify Moderator
All the results below in the graphs are taken from Mathcad 11.
--------------------------------
With
Case 1:
Case 2:
Case 3:
--------------------------------
Without:
Case 1:
Case 2:
Case 3:
--------------------------------
On the other hand, what I find a little strange is that in Mathcad 15 once I checked the box corresponding to the x-axis in which I specify to the graph that the x-axis represents a logarithmic axis then I don't have to create a variable for the x-axis so that I clearly specify that the x-axis is a logarithmic axis because I created a variable to do this, while, as you say, in Mathcad 11 I have to create such a variable even if I checked the x-axis box in which tell him that the x-axis represents a logarithmic axis.
Therefore why in Mathcad 15 I do not have to create such a variable to take into account that the x-axis represents a logarithmic axis (it is enough only if I specify in the graph properties that the x-axis represents a logarithmic axis), and in Mathcad 11 do I have to create such a variable that takes into account the fact that the x-axis represents a logarithmic axis (even if in the properties of the graph I checked that the x-axis is a logarithmic axis)?
And could you put a Mathcad 11 file with the implementation of the version you are talking about?
It would be useful for me to have an example as an example 🙂
(Attached is a Mathcad 11 File)
Thanks.
- Mark as New
- Bookmark
- Subscribe
- Mute
- Subscribe to RSS Feed
- Permalink
- Notify Moderator
You forgot to put f as an index to freq every where you use freq in the plots.
Success!
Luc
- Mark as New
- Bookmark
- Subscribe
- Mute
- Subscribe to RSS Feed
- Permalink
- Notify Moderator
Aha. Ok. Good.
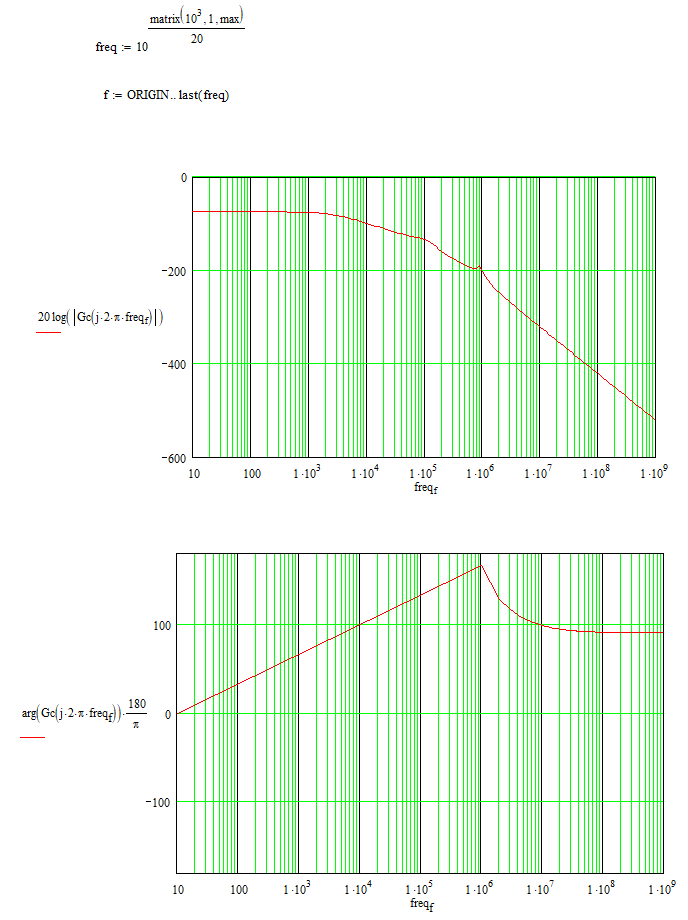
It seems to work like this, but still, the phase diagram (the second graph) does not look 100% like in Mathcad 15.
Mathcad 15:
From what I see, at high frequencies (> 1MHz) the graphics seem to look the same, but at frequencies below 1MHz things are not the same.
Why does it appear like that?
And something else:
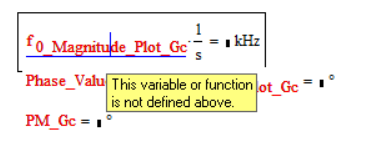
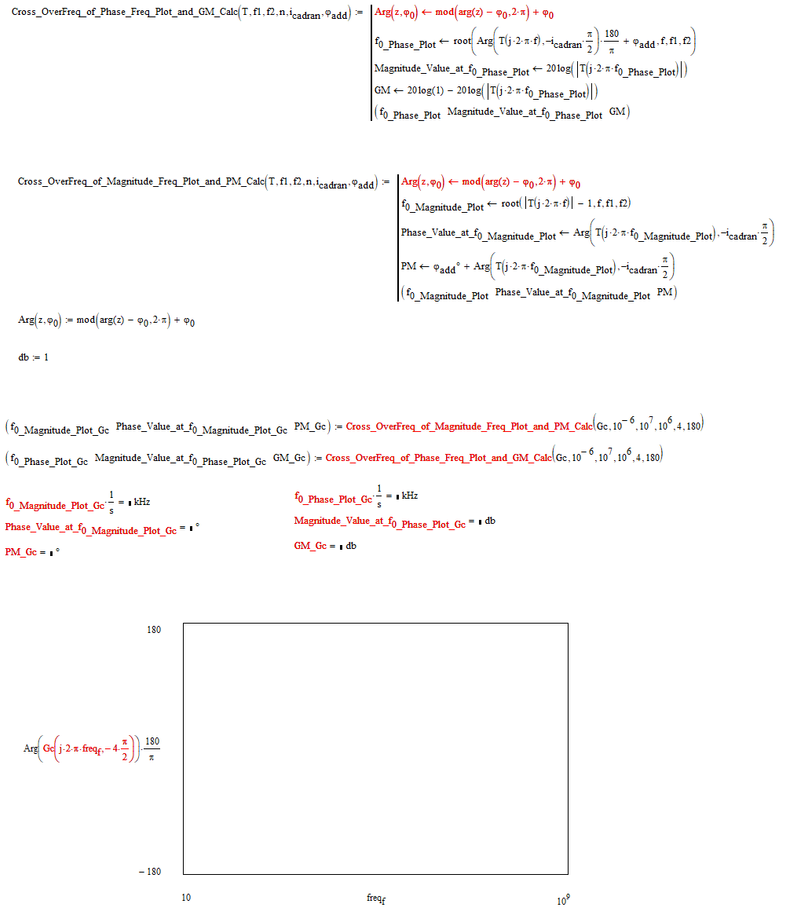
I would like to pass these functions implemented in Mathcad 15 to Mathcad 11 (to work and have these functions in MC11 as well), but I see that there are some errors that I do not know how to solve.
Could you take a look here too?
Thanks.
- Mark as New
- Bookmark
- Subscribe
- Mute
- Subscribe to RSS Feed
- Permalink
- Notify Moderator
I made a typo when entering the index f at freq for the phase graph.
After I corrected it, it looks better now.
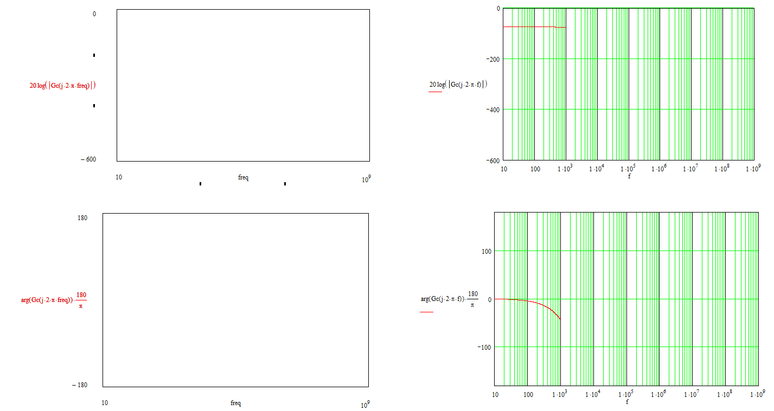
I saw that I can't exceed the value of 10^3, which I don't know if in all cases I won't have to exceed it.
Can it be expanded in any way? or to somehow overcome the limitation in this regard?
Therefore, it only remains related to this issue if you can look and have a solution/suggestion.
Thanks.
- Mark as New
- Bookmark
- Subscribe
- Mute
- Subscribe to RSS Feed
- Permalink
- Notify Moderator
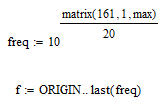
The function 'matrix(n,1,max)' creates a vector of n elements, with values from 0 to n-1.
It is set as the exponent to 10, so 10 ^(matrix(10^3,1,max)/20), creates a vector of 1000 elements, starting at 10^0 (which is 1) and ending at 10^999/20 = 10^50 (and we're talking frequency here, so that would be Hz), that is way beyond the frequency range you are (most probably) interested in. If you want more points, divide them over the decades, by increasing the number 20 to 125, to reduce the frequency span to 8 decades (when n=1000).
Incidentally, this way of creating a vector with the matrix() function works in Mathcad 11 and in Prime, but not in Mathcad 15...
Success!
Luc
- Mark as New
- Bookmark
- Subscribe
- Mute
- Subscribe to RSS Feed
- Permalink
- Notify Moderator
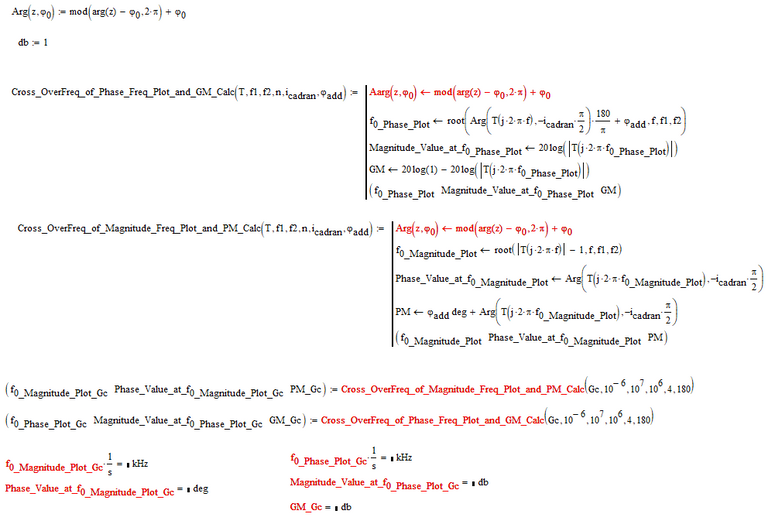
In Mathcad 11 you cannot define a (local) function within a program, as opposed to Mathcad 15. That means the first statement in both programmed functions "Cross_overFreq_of_Phase..." and "Cross_overFreq_of_Magnitude...", where you define the local function Arg() causes an error.
One solution is to take that function separately, outside of either of the two functions. Which you did, but the function definition must be above those of the two Cross_over... functions.
Another solution is to write the expression out, there where you call the function.
I'd take the first option.
Then the next error is that the 'degree' symbol (°) is not defined, so you need to define that as well, also before the two Cross_over functions.
Now the functions work, but the interval you set doesn't work for the Cross_overFreq_of_Magnitude... call. It doesn't see your magnitude cross the 0 dB line (where magnitude is1).
Success!
Luc
- Mark as New
- Bookmark
- Subscribe
- Mute
- Subscribe to RSS Feed
- Permalink
- Notify Moderator
- Mark as New
- Bookmark
- Subscribe
- Mute
- Subscribe to RSS Feed
- Permalink
- Notify Moderator
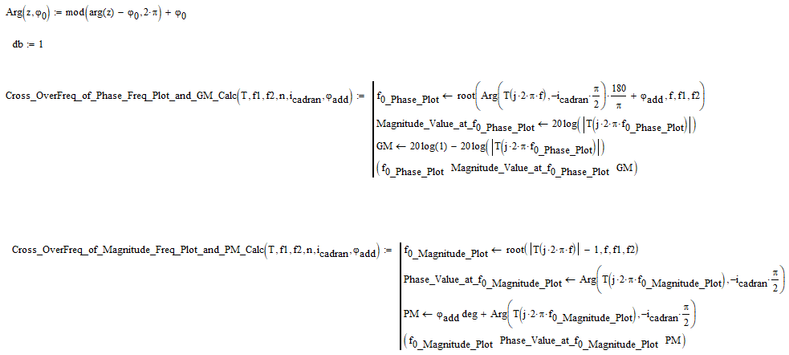
I think so, I just had to delete Arg() from inside the function:
if I still have doubts, I write
Thanks.
- Mark as New
- Bookmark
- Subscribe
- Mute
- Subscribe to RSS Feed
- Permalink
- Notify Moderator
Do you even know other methods/variants of implementation besides that:
?
Thanks.
- Mark as New
- Bookmark
- Subscribe
- Mute
- Subscribe to RSS Feed
- Permalink
- Notify Moderator
There are many ways that lead to Rome (if not all).
I wonder if this is equivalent to the function logspace as implemented in Mathcad 15.
Try out
Hmmm. This is what Prime produces (and, if copied from Mathcad 15, I have my answer):
I don't see the first decade end at 120.
Ah, the third parameter is the total number of points generated, instead of the number of points per decade.
To implement that you could:
Success!
Luc

