Community Tip - Need to share some code when posting a question or reply? Make sure to use the "Insert code sample" menu option. Learn more! X
- Subscribe to RSS Feed
- Mark Topic as New
- Mark Topic as Read
- Float this Topic for Current User
- Bookmark
- Subscribe
- Mute
- Printer Friendly Page
Can I plot a function containing unknown constants in mathcad?
- Mark as New
- Bookmark
- Subscribe
- Mute
- Subscribe to RSS Feed
- Permalink
- Notify Moderator
Can I plot a function containing unknown constants in mathcad?
example f(x)=ax ,
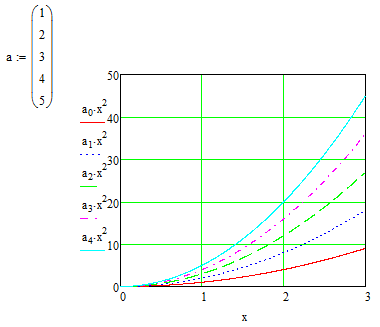
I want to plot for any variable of a
- Labels:
-
Other
- Mark as New
- Bookmark
- Subscribe
- Mute
- Subscribe to RSS Feed
- Permalink
- Notify Moderator
You need to make the function depend on 'a' as well as 'x'. The attached shows how to do it using a slider to vary the value of 'a' (though you can set 'a' any way you want).
Alan
- Mark as New
- Bookmark
- Subscribe
- Mute
- Subscribe to RSS Feed
- Permalink
- Notify Moderator
Or so

- Mark as New
- Bookmark
- Subscribe
- Mute
- Subscribe to RSS Feed
- Permalink
- Notify Moderator
Thanks , very much . this was helpful
but , Is there another way (other than the slider method) I can plot the function without specifying any values of a
OR just specifying an interval like a=[0, infinity]
- Mark as New
- Bookmark
- Subscribe
- Mute
- Subscribe to RSS Feed
- Permalink
- Notify Moderator
You can't really expect Mathcad to plot without knowing one or more values of 'a'!
However, you could plot a surface using a 3d plot for a specified range of values of 'a' and 'x'.
For example:
Alan
- Mark as New
- Bookmark
- Subscribe
- Mute
- Subscribe to RSS Feed
- Permalink
- Notify Moderator
A solution of the z(x, x) without an an an an an imation is not solution:


