
Turn on suggestions
Auto-suggest helps you quickly narrow down your search results by suggesting possible matches as you type.
Showing results for
Please log in to access translation
Turn on suggestions
Auto-suggest helps you quickly narrow down your search results by suggesting possible matches as you type.
Showing results for
Community Tip - You can subscribe to a forum, label or individual post and receive email notifications when someone posts a new topic or reply. Learn more! X
Translate the entire conversation x
Please log in to access translation
Options
- Subscribe to RSS Feed
- Mark Topic as New
- Mark Topic as Read
- Float this Topic for Current User
- Bookmark
- Subscribe
- Mute
- Printer Friendly Page
Chart component. Min. and max. values for axis with functions.
Apr 13, 2022
03:52 AM
- Mark as New
- Bookmark
- Subscribe
- Mute
- Subscribe to RSS Feed
- Permalink
- Notify Moderator
Please log in to access translation
Apr 13, 2022
03:52 AM
Chart component. Min. and max. values for axis with functions.
Hi
I need to define the max. and min. values for different graphs using some simple functions,
for example 1.2 times the max. computed X -value.
This was possible with Mathcad 15, but is it somehow possible with Prime 7?
What I have found so far, is that a user can only set max. and min. values manually, which is far from handy...
Also "Trace" option is missing from Prime...
As attached is a screen shot from Mathcad15 to illustrate what I mean.
Solved! Go to Solution.
Labels:
- Labels:
-
Mathcad Usage
ACCEPTED SOLUTION
Accepted Solutions
Apr 13, 2022
04:43 AM
- Mark as New
- Bookmark
- Subscribe
- Mute
- Subscribe to RSS Feed
- Permalink
- Notify Moderator
Please log in to access translation
Apr 13, 2022
04:43 AM
@TikkaMasala wrote:
Hi Stuart
Thanks for the quick answer.
Please correct me if I'm wrong, but your proposal only works when a graph is inserted from "plots" -> "x-y plots" -menus.
These plot types are very limited when editing and illustration of results is concerned...
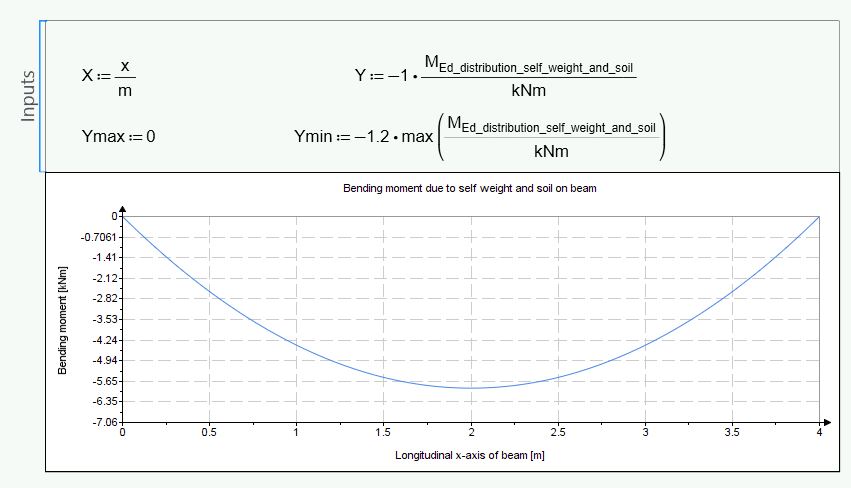
With "Chart component" from "Math" menu, I can get somewhat decent looking graphs, but is it possible to get max. and min. values for the axis in these graphs similarly as in your proposal?
Yes, you can do it somewhat easier in the Chart component. The limits have predefined names and you simply assign the value you want to them.

Stuart
4 REPLIES 4
Apr 13, 2022
04:09 AM
- Mark as New
- Bookmark
- Subscribe
- Mute
- Subscribe to RSS Feed
- Permalink
- Notify Moderator
Please log in to access translation
Apr 13, 2022
04:09 AM
@TikkaMasala wrote:
Hi
I need to define the max. and min. values for different graphs using some simple functions,
for example 1.2 times the max. computed X -value.
This was possible with Mathcad 15, but is it somehow possible with Prime 7?
What I have found so far, is that a user can only set max. and min. values manually, which is far from handy...
Also "Trace" option is missing from Prime...
As attached is a screen shot from Mathcad15 to illustrate what I mean.
Yes, it is possible to add computed limits and in pretty much the same way as in M15. There are no place markers as in M15 and the process is a little bit more fiddly because of the small font sizes, but ...
You have to place your cursor in the max value on the axis, delete the value, and then type your expression.

However, the Trace and Zoom functionalities are missing.
Stuart
Apr 13, 2022
04:25 AM
- Mark as New
- Bookmark
- Subscribe
- Mute
- Subscribe to RSS Feed
- Permalink
- Notify Moderator
Please log in to access translation
Apr 13, 2022
04:25 AM
Hi Stuart
Thanks for the quick answer.
Please correct me if I'm wrong, but your proposal only works when a graph is inserted from "plots" -> "x-y plots" -menus.
These plot types are very limited when editing and illustration of results is concerned...
With "Chart component" from "Math" menu, I can get somewhat decent looking graphs, but is it possible to get max. and min. values for the axis in these graphs similarly as in your proposal?
Apr 13, 2022
04:43 AM
- Mark as New
- Bookmark
- Subscribe
- Mute
- Subscribe to RSS Feed
- Permalink
- Notify Moderator
Please log in to access translation
Apr 13, 2022
04:43 AM
@TikkaMasala wrote:
Hi Stuart
Thanks for the quick answer.
Please correct me if I'm wrong, but your proposal only works when a graph is inserted from "plots" -> "x-y plots" -menus.
These plot types are very limited when editing and illustration of results is concerned...
With "Chart component" from "Math" menu, I can get somewhat decent looking graphs, but is it possible to get max. and min. values for the axis in these graphs similarly as in your proposal?
Yes, you can do it somewhat easier in the Chart component. The limits have predefined names and you simply assign the value you want to them.
Stuart
Apr 13, 2022
07:32 AM
- Mark as New
- Bookmark
- Subscribe
- Mute
- Subscribe to RSS Feed
- Permalink
- Notify Moderator
Please log in to access translation


