Community Tip - Your Friends List is a way to easily have access to the community members that you interact with the most! X
- Subscribe to RSS Feed
- Mark Topic as New
- Mark Topic as Read
- Float this Topic for Current User
- Bookmark
- Subscribe
- Mute
- Printer Friendly Page
Concept of vectors in a matrix and their plotting
- Mark as New
- Bookmark
- Subscribe
- Mute
- Subscribe to RSS Feed
- Permalink
- Notify Moderator
Concept of vectors in a matrix and their plotting
I am facing a problem and can't figure out what is going on. I have seen previous posts on the community but not able to grasp the concept of vectors. Please, someone, explain the difference in clear terms so that nothing remains ambiguous.
The first problem is I am trying to return two vectors in a 1x2 vector. This means it will be a nested vector. I have seen some posts where it is done but when I try to do it, it gives the dimension of a vector rather than the vector itself. Of course, the problems resolve when I use the augment command but I want to know why it is not printing the vector.
In the below figure (obtain from the community) the D shows the vector elements but when I try to display it again, it display the size of the vector 😫
Similarly, the second problem is that when I try to plot vectors it says, "These array elements must be scalar. They cannot be vectors or matrices". But when I search the community there were examples where these plots were made. So, I am confused 😕
Here is the example where such plots were made.
Mathcad Prime 7 files are attached
Solved! Go to Solution.
- Labels:
-
Math Homework
-
Mathcad Usage
-
Programming
Accepted Solutions
- Mark as New
- Bookmark
- Subscribe
- Mute
- Subscribe to RSS Feed
- Permalink
- Notify Moderator
To see the real contents of nested matrices rather than just the dimensions, you have to uncheck "Collapse Nested Matrices" on the "Matrices/Tables" tab.
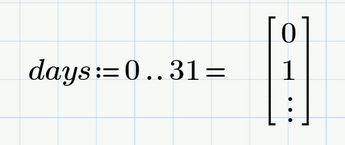
According your plotting problem you must be aware, that your variable "days" is not a vector but a range. Unfortunately ranges and vectors look the same when you display them.
A range is sort of an implicit loop and should be used for
1) index the elements of vectors and matrices
2) define the plot range of a 2D-plot when you plot functions
3) a for-loop in a Mathcad program
and thats all.
To define "days" as a vector you may do it as follows:
Note that you have to use the vector index and not the literal index here.
You may also use a convenient undocumented (and unsupported) trick to turn a range into a vector:
The evaluation (=) immediately after the definition turns the range into a vector.
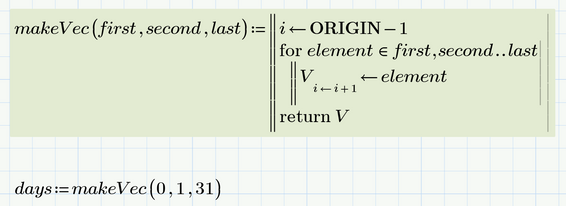
In this forum from time to time functions to create a vector were posted which you could use if you need to do it often. Here is a variant which follows the syntax of the range definition - you have to provide the first, second and last value in your vector. As usual in a range, the last value must not be necessarily part of the vector. In contrary to a range definition this function does not allow to omit the second value.
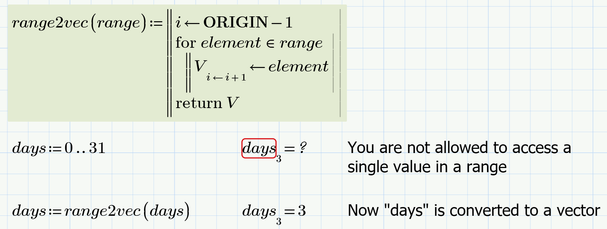
And if you don't like the trick with the inline evaluation, you may use a function to turn a range into a vector
- Mark as New
- Bookmark
- Subscribe
- Mute
- Subscribe to RSS Feed
- Permalink
- Notify Moderator
In the previous files that were attached, the changes were not saved. I have updated the files where the necessary changes that I do have been saved.
- Mark as New
- Bookmark
- Subscribe
- Mute
- Subscribe to RSS Feed
- Permalink
- Notify Moderator
To see the real contents of nested matrices rather than just the dimensions, you have to uncheck "Collapse Nested Matrices" on the "Matrices/Tables" tab.
According your plotting problem you must be aware, that your variable "days" is not a vector but a range. Unfortunately ranges and vectors look the same when you display them.
A range is sort of an implicit loop and should be used for
1) index the elements of vectors and matrices
2) define the plot range of a 2D-plot when you plot functions
3) a for-loop in a Mathcad program
and thats all.
To define "days" as a vector you may do it as follows:
Note that you have to use the vector index and not the literal index here.
You may also use a convenient undocumented (and unsupported) trick to turn a range into a vector:
The evaluation (=) immediately after the definition turns the range into a vector.
In this forum from time to time functions to create a vector were posted which you could use if you need to do it often. Here is a variant which follows the syntax of the range definition - you have to provide the first, second and last value in your vector. As usual in a range, the last value must not be necessarily part of the vector. In contrary to a range definition this function does not allow to omit the second value.
And if you don't like the trick with the inline evaluation, you may use a function to turn a range into a vector
- Mark as New
- Bookmark
- Subscribe
- Mute
- Subscribe to RSS Feed
- Permalink
- Notify Moderator
- Tags:
- Prime_7.0


