Community Tip - Did you get called away in the middle of writing a post? Don't worry you can find your unfinished post later in the Drafts section of your profile page. X
- Subscribe to RSS Feed
- Mark Topic as New
- Mark Topic as Read
- Float this Topic for Current User
- Bookmark
- Subscribe
- Mute
- Printer Friendly Page
Contour Plot
- Mark as New
- Bookmark
- Subscribe
- Mute
- Subscribe to RSS Feed
- Permalink
- Notify Moderator
Contour Plot
Dear All,
I want to make a contour plot from a Matrix 2D which I can do, but the axes X and Y are labeled as 1, 2, 3, and so on. How can I change it to represent the real values?
Just to clear the question. The matrix is the result of a Heat transfer analysis on which each cell represent an (x,y) position with the value representing the temperature on that position.
All the best
Solved! Go to Solution.
- Labels:
-
Statistics_Analysis
- Tags:
- contour_plot_matrix
Accepted Solutions
- Mark as New
- Bookmark
- Subscribe
- Mute
- Subscribe to RSS Feed
- Permalink
- Notify Moderator
Lourival Mendes wrote:
Dear All,
I want to make a contour plot from a Matrix 2D which I can do, but the axes X and Y are labeled as 1, 2, 3, and so on. How can I change it to represent the real values?
Just to clear the question. The matrix is the result of a Heat transfer analysis on which each cell represent an (x,y) position with the value representing the temperature on that position.
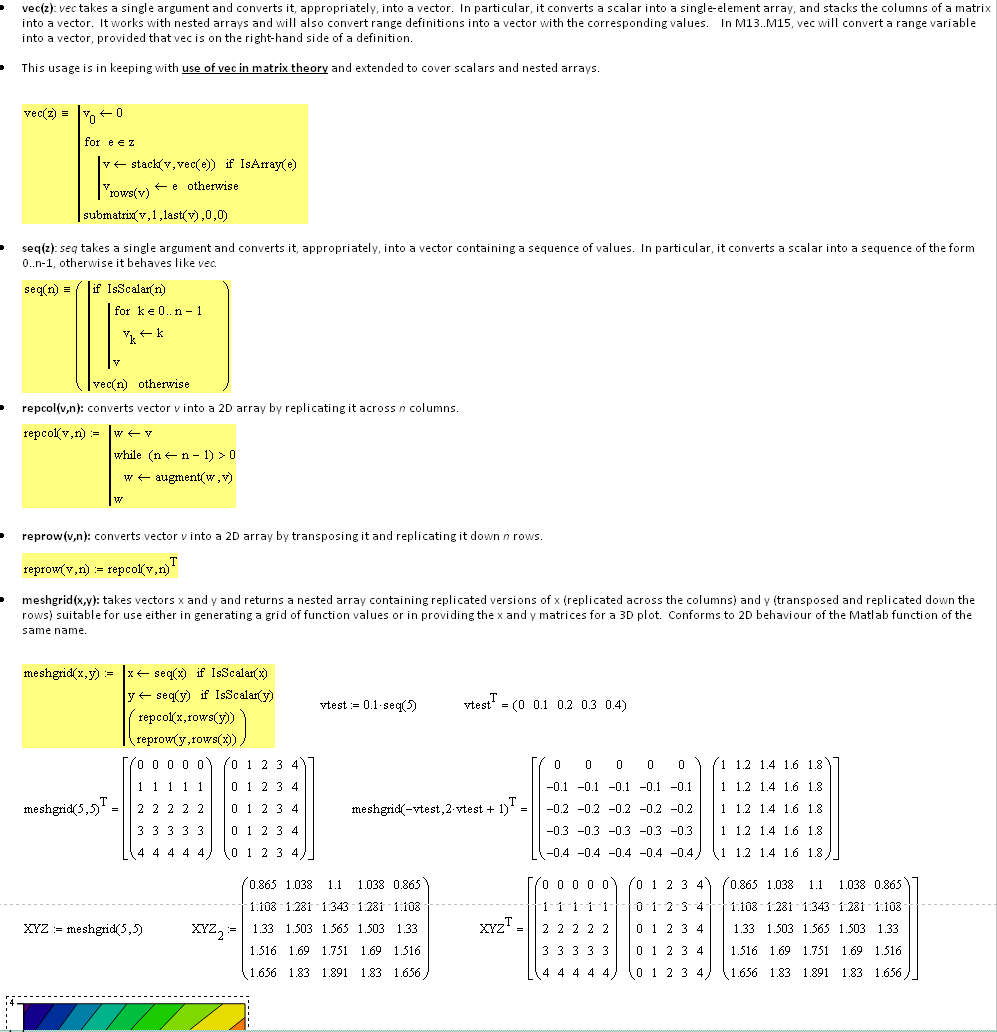
As Richard says, you need to create arrays of your x and y values that are conformable to the results matrix; if m = rows(x) and n = rows(y), then the 'x' matrix should have n columns all filled with x, and the 'y' matrix should have m rows all filled with y (transposed).
There is a long-standing request to provide variants of CreateMesh that allow the user to provide x and y vectors rather than let the function apply a default grid (or, just as bad, have to go poking around in the dialog box to set min/max axis values and number of grid points).
It could possibly be done by allowing the CreateMesh arguments s0 and t0 to be vectors or scalars, for example, with Mathcad assuming that only two arguments (in addition to the target function) implies that s1 is missing and that s0 and t0 are either a vector of values to evaluate at each grid point or represent the upper limit of a 0..s0/t0 range with the default sgrid/tgrid = 20.
Stuart


- Mark as New
- Bookmark
- Subscribe
- Mute
- Subscribe to RSS Feed
- Permalink
- Notify Moderator
Create a nested matrix of three matrices that represent the x, y, and z values. Without the x and y values Mathcad just assigns the row and column indices as x and y.
- Mark as New
- Bookmark
- Subscribe
- Mute
- Subscribe to RSS Feed
- Permalink
- Notify Moderator
Thank you for your answer!! It was not clear for me until StuartBruff clear it up
Thanks!!
- Mark as New
- Bookmark
- Subscribe
- Mute
- Subscribe to RSS Feed
- Permalink
- Notify Moderator
Lourival Mendes wrote:
Dear All,
I want to make a contour plot from a Matrix 2D which I can do, but the axes X and Y are labeled as 1, 2, 3, and so on. How can I change it to represent the real values?
Just to clear the question. The matrix is the result of a Heat transfer analysis on which each cell represent an (x,y) position with the value representing the temperature on that position.
As Richard says, you need to create arrays of your x and y values that are conformable to the results matrix; if m = rows(x) and n = rows(y), then the 'x' matrix should have n columns all filled with x, and the 'y' matrix should have m rows all filled with y (transposed).
There is a long-standing request to provide variants of CreateMesh that allow the user to provide x and y vectors rather than let the function apply a default grid (or, just as bad, have to go poking around in the dialog box to set min/max axis values and number of grid points).
It could possibly be done by allowing the CreateMesh arguments s0 and t0 to be vectors or scalars, for example, with Mathcad assuming that only two arguments (in addition to the target function) implies that s1 is missing and that s0 and t0 are either a vector of values to evaluate at each grid point or represent the upper limit of a 0..s0/t0 range with the default sgrid/tgrid = 20.
Stuart


