
Turn on suggestions
Auto-suggest helps you quickly narrow down your search results by suggesting possible matches as you type.
Showing results for
Please log in to access translation
Turn on suggestions
Auto-suggest helps you quickly narrow down your search results by suggesting possible matches as you type.
Showing results for
Community Tip - Did you know you can set a signature that will be added to all your posts? Set it here! X
Translate the entire conversation x
Please log in to access translation
Options
- Subscribe to RSS Feed
- Mark Topic as New
- Mark Topic as Read
- Float this Topic for Current User
- Bookmark
- Subscribe
- Mute
- Printer Friendly Page
Contour plot in Mathcad Prime 2.0
Jun 07, 2012
04:58 PM
- Mark as New
- Bookmark
- Subscribe
- Mute
- Subscribe to RSS Feed
- Permalink
- Notify Moderator
Please log in to access translation
Jun 07, 2012
04:58 PM
Contour plot in Mathcad Prime 2.0
Hello,
I need to create a contour plot based on 3 dimensional free data but I'm having issues. I've created a matrix with my data:
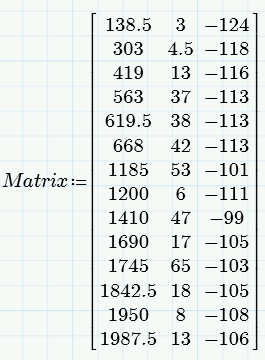
and try to do a contour plot but it does not graph it properly. I think the data must be defined on a grid of some sort but I'm not sure how to use CreateMesh since this is free data and not a function. FYI the data is the matrix is (frequency, tuning sensitivity, phase noise.)
I've also tried doing it as a 3-D plot and the data points show up correctly but I need it displayed in a contour format.
I'd appreciate any help.
Thanks,
Matt
Labels:
- Labels:
-
Statistics_Analysis
14 REPLIES 14
Jun 07, 2012
05:13 PM
- Mark as New
- Bookmark
- Subscribe
- Mute
- Subscribe to RSS Feed
- Permalink
- Notify Moderator
Please log in to access translation
Jun 07, 2012
05:13 PM
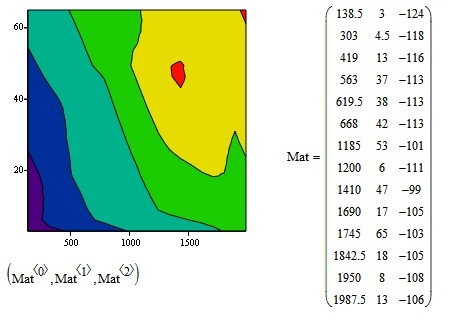
On the assumption that columns 0, 1 & 2 in your matrix represent the x, y & z data, respectively, then try typing the following into the placeholder in the contour plot:
(Mat<0>,Mat<1>,Mat<2>)
Stuart
Jun 07, 2012
05:27 PM
- Mark as New
- Bookmark
- Subscribe
- Mute
- Subscribe to RSS Feed
- Permalink
- Notify Moderator
Please log in to access translation
Jun 07, 2012
05:27 PM
You are correct, columns 0, 1, and 2 represent the x, y, and z data. Here is what my contour plot currently looks like:
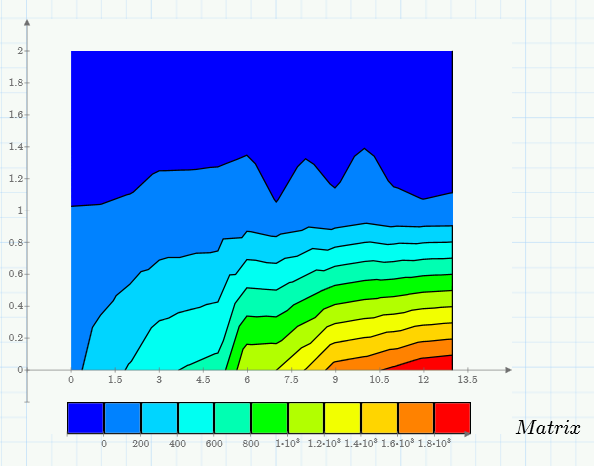
which is obviouly not correct. If I try to put anything into the units placeholder it tells me "this variable is undefined" When you say (Mat<0>, Mat<1>,Mat<2>) is Mat short for Matrix?
Jun 07, 2012
05:42 PM
- Mark as New
- Bookmark
- Subscribe
- Mute
- Subscribe to RSS Feed
- Permalink
- Notify Moderator
Please log in to access translation
Jun 07, 2012
05:42 PM
matt eckdahl wrote:
You are correct, columns 0, 1, and 2 represent the x, y, and z data. Here is what my contour plot currently looks like:
which is obviouly not correct.
What I get (in Mathcad 11, I don't have Prime 2.0) is
If I try to put anything into the units placeholder it tells me "this variable is undefined"
I meant the plot component placeholder (the black square (or whatever Prime has) where you type the data to be plotted.
When you say (Mat<0>, Mat<1>,Mat<2>) is Mat short for Matrix?
Yes, sorry about that, I have a function in my library call Matrix so I shortened your variable name by reflex! 
Jun 07, 2012
06:08 PM
- Mark as New
- Bookmark
- Subscribe
- Mute
- Subscribe to RSS Feed
- Permalink
- Notify Moderator
Please log in to access translation
Jun 07, 2012
06:08 PM
That is exactly what I'm looking for but I'm not able to get it to work in Prime. I wish I had access to an older version of Mathcad. When I try entering what you show I get "unknown error: bad%_application"
Jun 07, 2012
06:33 PM
- Mark as New
- Bookmark
- Subscribe
- Mute
- Subscribe to RSS Feed
- Permalink
- Notify Moderator
Please log in to access translation
Jun 07, 2012
06:33 PM
matt eckdahl wrote:
I wish I had access to an older version of Mathcad.
If you've got Prime 2.0, you should either have, or be able to download, Mathcad 15
matt eckdahl wrote:
That is exactly what I'm looking for but I'm not able to get it to work in Prime. ... When I try entering what you show I get "unknown error: bad%_application"
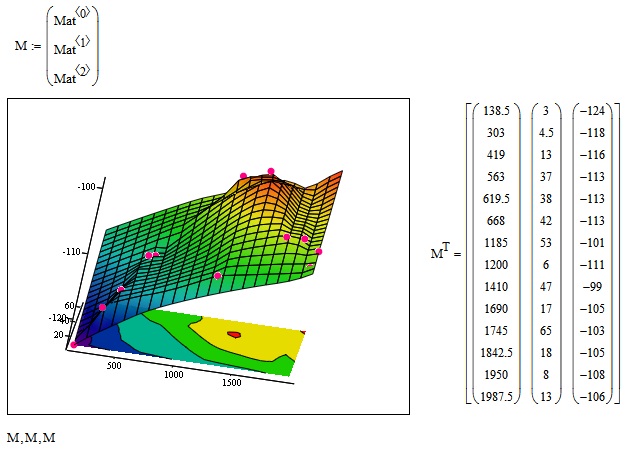
There's an alternative format that works in M11 and M15, it might be worth trying - M is a 3x1 vector. The plot below shows a contour, surface and scatter plot of the same data.
What does Prime Help say about the input format for a contour plot?
Jun 08, 2012
11:40 AM
- Mark as New
- Bookmark
- Subscribe
- Mute
- Subscribe to RSS Feed
- Permalink
- Notify Moderator
Please log in to access translation
Jun 08, 2012
11:40 AM
I will look into the possibility of getting/using Mathcad 15 (which I would prefer to Prime) but in the meantime Prime help says (regarding input data):
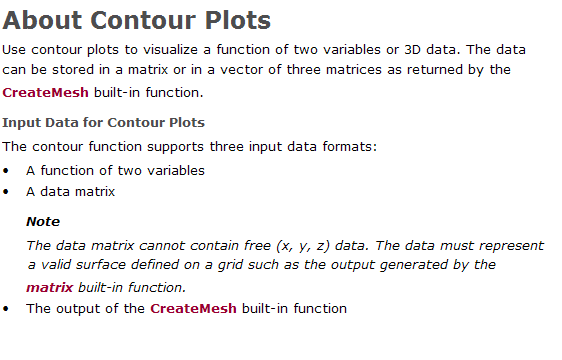
So I think the issue I'm running in to is "the data matrix cannot contain free (x,y,z) data"
I tried to do the vector and for some reason it doesn't like that either. When I tried to plot Mat<0>,Mat<1>,Mat<2> earlier, as soon as I hit the comma it forces me to enter in the X,Y...Z format because it thinks I'm trying to enter a variable range. Man I'm not a fan of Prime so far.
Jun 08, 2012
11:46 AM
- Mark as New
- Bookmark
- Subscribe
- Mute
- Subscribe to RSS Feed
- Permalink
- Notify Moderator
Please log in to access translation
Jun 08, 2012
11:46 AM
matt eckdahl wrote:
I will look into the possibility of getting/using Mathcad 15 (which I would prefer to Prime) but in the meantime Prime help says (regarding input data):
So I think the issue I'm running in to is "the data matrix cannot contain free (x,y,z) data"
That's a possibility, Matt, and would represent a significant change from previous versions of Mathcad. Unfortunately, I know absolutely nothing about Prime 2.0's plotting. Hopefully, Mona or one of the other readers can provide further insight. I can check later if it's possible to create the nested array M in Prime 1.0.
Stuart
Jun 08, 2012
11:54 AM
- Mark as New
- Bookmark
- Subscribe
- Mute
- Subscribe to RSS Feed
- Permalink
- Notify Moderator
Please log in to access translation
Jun 08, 2012
11:54 AM
Thanks for your help Stuart, I appreciate it.
Matt
Jun 08, 2012
12:58 PM
- Mark as New
- Bookmark
- Subscribe
- Mute
- Subscribe to RSS Feed
- Permalink
- Notify Moderator
Please log in to access translation
Jun 08, 2012
12:58 PM
Matt,
If you have Prime don't you also have M15?
Mike
Jun 08, 2012
03:05 PM
- Mark as New
- Bookmark
- Subscribe
- Mute
- Subscribe to RSS Feed
- Permalink
- Notify Moderator
Please log in to access translation
Jun 08, 2012
03:05 PM
Matt,
You are correct, that Mathcad Prime 2.0 cannot plot free (x,y,z) data in a contour plot. We have been discussing how to add that capability to Mathcad Prime for a future release , so I'll use your data as an example for the developer.
You can add additional traces to any plot in Mathcad Prime. Just press Shift-Enter instead of typing a comma. Or click on Add Trace button in the Plots tab.
Mona
Jun 09, 2012
03:34 AM
- Mark as New
- Bookmark
- Subscribe
- Mute
- Subscribe to RSS Feed
- Permalink
- Notify Moderator
Please log in to access translation
Jun 09, 2012
03:34 AM
Mona Zeftel wrote:
You are correct, that Mathcad Prime 2.0 cannot plot free (x,y,z) data in a contour plot. We have been discussing how to add that capability to Mathcad Prime for a future release , so I'll use your data as an example for the developer.
An example worksheet in M11 format, Mona, should it be of any use in supporting the case. Works in M11 and M15.
Stuart
Jun 09, 2012
04:24 AM
- Mark as New
- Bookmark
- Subscribe
- Mute
- Subscribe to RSS Feed
- Permalink
- Notify Moderator
Please log in to access translation
Jun 09, 2012
04:24 AM
matt eckdahl wrote:
...I wish I had access to an older version of Mathcad...
You can download Mathcad 15.0 free 30-day trial version here: http://www.ptc.com/products/mathcad/mathcad-15-0/free-trial.htm
Jun 09, 2012
08:29 AM
- Mark as New
- Bookmark
- Subscribe
- Mute
- Subscribe to RSS Feed
- Permalink
- Notify Moderator
Please log in to access translation
Jun 09, 2012
08:29 AM
If he has Prime, shouldn't he also have M15?
Mike
Jun 09, 2012
12:51 PM
- Mark as New
- Bookmark
- Subscribe
- Mute
- Subscribe to RSS Feed
- Permalink
- Notify Moderator
Please log in to access translation
Jun 09, 2012
12:51 PM
Yes, that's correct. But just in case I gave an additional link.


