
Turn on suggestions
Auto-suggest helps you quickly narrow down your search results by suggesting possible matches as you type.
Showing results for
Please log in to access translation
Turn on suggestions
Auto-suggest helps you quickly narrow down your search results by suggesting possible matches as you type.
Showing results for
Community Tip - New to the community? Learn how to post a question and get help from PTC and industry experts! X
Translate the entire conversation x
Please log in to access translation
Options
- Subscribe to RSS Feed
- Mark Topic as New
- Mark Topic as Read
- Float this Topic for Current User
- Bookmark
- Subscribe
- Mute
- Printer Friendly Page
Converting the results of ODESOLVE in different coordinates in PRIME 2.0
Jun 06, 2013
09:30 AM
- Mark as New
- Bookmark
- Subscribe
- Mute
- Subscribe to RSS Feed
- Permalink
- Notify Moderator
Please log in to access translation
Jun 06, 2013
09:30 AM
Converting the results of ODESOLVE in different coordinates in PRIME 2.0
Hello Mathcad-Community,
I need help on converting the results of a solved differential equation in different coordinates in Mathcad Prime 2.0. Some days ago, I had a problem solving a system of 5 differential equation (some of you might remember). It was about a stream of gas flowing out of a broken tank/pipeline while experiencing wind from one side.
Before I got the equations to start the solving process, I had to convert the coordinates from cartesian to curvilinear coordinates. So actually i changed x,y and z to s (distance from the source in the center of the stream), r (distance from center of the stream) and the angel phi (you can imagine that as a rotation around the center of the stream). The direction of the wind is directed parallel to the y-axis. Maybe this scetch will help: EDIT: you can find the scetch in my file. I tried to implement it in the text, but it didn't work. It's at the top of the file below.
With the 5 differential equations, I was able to calculate the concentration c, Temperature T, Speed u, broadth of the stream b and the angle Theta between the s- and the y-Axis. The stream is axisymmetric, so the value for example c, or T at a certain distance r from the center of the stream is the same for every angle Phi around the axis.
If i take for example the concentration c, I am able to calculate the concentration for every point, dependant on s and r (its the same for all values of Phi, if s and r are known). If I want to know where this point is in cartesian coordinates, I have to use the equations for x, y and z below the charts in my added file. (you can ignore the whole part before the charts, this part works!)
What i want to do now is to re-convert the function into cartesian coordinates, or at least create a new function that does all the work of calculating point for point, so I don't have to do this by hand. I thought about creating a matrix with all the results for (for example) c(s,r) and a new function that takes out point after point of that matrix and converts it into x,y and z coordinates with the 3 functions in my file, but I don't know how that works.
Do you guys have an idea and could maybe help me?
Any help would be appreciated.
Regards
Tim
Labels:
- Labels:
-
Other
8 REPLIES 8
Jun 06, 2013
11:34 AM
- Mark as New
- Bookmark
- Subscribe
- Mute
- Subscribe to RSS Feed
- Permalink
- Notify Moderator
Please log in to access translation
Jun 06, 2013
11:34 AM
Your coordinate system looks very close to a cylindrical coordinate, Mathcad has coordinate-to coordinate mapping functions built in for most of the standard systems.
Jun 06, 2013
11:50 AM
- Mark as New
- Bookmark
- Subscribe
- Mute
- Subscribe to RSS Feed
- Permalink
- Notify Moderator
Please log in to access translation
Jun 06, 2013
11:50 AM
As I understand the goal is to provide a set of x,y and z values and calculate concentration, etc. for it.
Using the built-in coordinate mapping functions, as Fred outlined, would be the preferred method. If thats not indicated for some reason you might use something like the attached, where I took your transformation equations and used a solve block to get the inverse functions. Nevertheless I suspect that that conversion (x,y,z) --> (s,l,phi) is not unique which it should be (apart from the angle), if its simple cylinder coordinates. So either we don't see cylinder coordinates or maybe there is an error in the formulas?
Jun 06, 2013
12:58 PM
- Mark as New
- Bookmark
- Subscribe
- Mute
- Subscribe to RSS Feed
- Permalink
- Notify Moderator
Please log in to access translation
Jun 06, 2013
12:58 PM
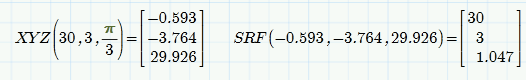
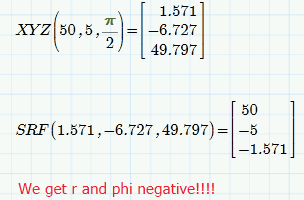
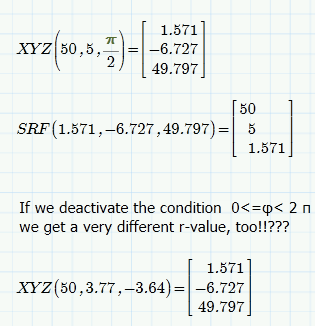
I have added conditions for r to be positive and phi in the range from 0 to 2*pi and we get consistent results. Getting r an phi negative was unwanted, but not wrong in a mathematical sense. But nowwe see a strange effect: If we deactive the range condition for phi, we get a value for r much different from the correct value of 5 in that example. Feeding those values in the XYZ function which uses the transformation equation you provided, we get the same result for x,y,z as with the triple where r is 5, so its a correct inverse, too. But how can that be? At least not possible if s,r,phi should be cylinder coordinates! How can two different sets of s,r,phi with different r yield the same point in space (x,y,z)?? You wrote that r is the distance of the point from "the center of the steam", whatever that may mean (disance from an axis, I guess). How can that distance have two different values (5 and 3.77)?? Are you absolutely sure about your transformation equations?
Jun 06, 2013
04:20 PM
- Mark as New
- Bookmark
- Subscribe
- Mute
- Subscribe to RSS Feed
- Permalink
- Notify Moderator
Please log in to access translation
Jun 06, 2013
04:20 PM
Hi guys,
thank you already for your help.
To Fred: I am pretty sure that these are not cylindrical coordinates, because if I'm right, the "middle"-Axis s should be straight and not curved like in my case. I will have a look into the integrated transformations though, thanks for that.
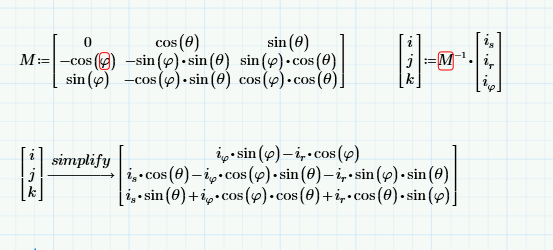
To Werner: Your solution looks quite appealing at first sight, but like u said, it's pretty unlikely or even impossible that the x-y-z values are the same for just a different r-value. Maybe my formulas are wrong as you said. I can attach a file with the original transformation process, as it was described in my source (see below). What i basically did, was that I simply solved the 3 equations for x, y and z (or in this case they were called i, j and k, as they are the unity vectors). Maybe that was mathematically wrong.
EDIT: I now achieved a different set of formulas. This is weird...next thing in the morning I will check these formulas with your solution. Maybe they will work out!
Regards,
Tim
Jun 06, 2013
04:39 PM
- Mark as New
- Bookmark
- Subscribe
- Mute
- Subscribe to RSS Feed
- Permalink
- Notify Moderator
Please log in to access translation
Jun 06, 2013
04:39 PM
Tim Siebert wrote:
EDIT: I now achieved a different set of formulas. This is weird...next thing in the morning I will check these formulas with your solution. Maybe they will work out!
Regards,
Tim
Here's a simpler check:
Alan
Jun 07, 2013
11:12 AM
- Mark as New
- Bookmark
- Subscribe
- Mute
- Subscribe to RSS Feed
- Permalink
- Notify Moderator
Please log in to access translation
Jun 07, 2013
11:12 AM
Hey guys,
So I tried Werner's method with my first formulas (which he used), with my "new" 2nd formulas (Which turn out to be the same) and with Alan's formulas (which create weird graphs but overall should come to approximately the same results (judging from the values i calculated).
I tried to plot the concentration for a fix height (z-axis) and x-value with a variable y-value. I achieved very "funny" results. Maybe you can have a look at the results in the attached file and tell me what you think of them.
I did not change Werner's data and I could create a graph that was appropriate until the y-value reaches 0. After that I checked my new formulas and I think they are exactly the same as the old ones. For those formulas I left out the extra conditions Werner introduced in his 2nd file, just to see what happens.
The graph that results from that is closest to the graph I want to achieve. It should have the form of a Gaussian distribution. But it's still not good enough.
Alan's formulas produced quite similare values, compared to the other formulas, but when I try to plot the same way, I did before it only plots one point at y=0.
If you can spare the time, please have a look at the file and tell me your thoughts about it.
Regards,
Tim
Jun 07, 2013
12:29 PM
- Mark as New
- Bookmark
- Subscribe
- Mute
- Subscribe to RSS Feed
- Permalink
- Notify Moderator
Please log in to access translation
Jun 07, 2013
12:29 PM
In the attached they all give similar curves now. I wouldn't know if they are the correct curves though!
Alan
Jun 08, 2013
10:24 AM
- Mark as New
- Bookmark
- Subscribe
- Mute
- Subscribe to RSS Feed
- Permalink
- Notify Moderator
Please log in to access translation
Jun 08, 2013
10:24 AM
I am still not sure about the correctness of the transformation equations.
The equations you provided in that document just show the relation between the unit vectors i,j,k of the static cartesian coordinate system with its origin in the starting point of the steam and the unit vectors (is,iphi,ir) of a nonstatic but local curvilienar coordinate systems, whose origin is moving along the center line of the steam, the position being defined by the arc lenght of that center line. I'm not sure about the correctness of your setting iphi=phi, e.g.
Furhermore I think it could not be possible to retransform from s,r,phi to static x,y,z without a function to calculate the y,z position of the origin of the local coordinate system for a given arclength s (or sL in your sheet).
In other words we would need a representation of the center line in the cartesion y,z-system. What we have so far is the slope angle theta as a function of the arc lenght.
But then, maybe I'm missing the point.


