
Turn on suggestions
Auto-suggest helps you quickly narrow down your search results by suggesting possible matches as you type.
Showing results for
Please log in to access translation
Turn on suggestions
Auto-suggest helps you quickly narrow down your search results by suggesting possible matches as you type.
Showing results for
Community Tip - Want the oppurtunity to discuss enhancements to PTC products? Join a working group! X
Translate the entire conversation x
Please log in to access translation
Options
- Subscribe to RSS Feed
- Mark Topic as New
- Mark Topic as Read
- Float this Topic for Current User
- Bookmark
- Subscribe
- Mute
- Printer Friendly Page
Count Values in a Matrix
Sep 13, 2016
04:37 PM
- Mark as New
- Bookmark
- Subscribe
- Mute
- Subscribe to RSS Feed
- Permalink
- Notify Moderator
Please log in to access translation
Sep 13, 2016
04:37 PM
Count Values in a Matrix
Hello,
I'm new to MathCAD and may have missed something obvious, but is it possible to count particular values in a matrix? For example, counting how many times the number "18" occurs in a 1 x 5 matrix.
Thanks,
Adrian
Solved! Go to Solution.
Labels:
- Labels:
-
Other
ACCEPTED SOLUTION
Accepted Solutions
Sep 13, 2016
05:01 PM
- Mark as New
- Bookmark
- Subscribe
- Mute
- Subscribe to RSS Feed
- Permalink
- Notify Moderator
Please log in to access translation
8 REPLIES 8
Sep 13, 2016
05:01 PM
- Mark as New
- Bookmark
- Subscribe
- Mute
- Subscribe to RSS Feed
- Permalink
- Notify Moderator
Please log in to access translation
Sep 13, 2016
05:01 PM
It's not only possible, it's very easy;

Sep 13, 2016
05:06 PM
- Mark as New
- Bookmark
- Subscribe
- Mute
- Subscribe to RSS Feed
- Permalink
- Notify Moderator
Please log in to access translation
Sep 13, 2016
05:06 PM
But if the value isn't present MathCAD returns an error. Sorry for not being clear, is there a way to return "0" if the value is not there?
Sep 13, 2016
05:14 PM
- Mark as New
- Bookmark
- Subscribe
- Mute
- Subscribe to RSS Feed
- Permalink
- Notify Moderator
Please log in to access translation
Sep 13, 2016
05:14 PM
No problem:

The "on error" statement is from the programming toolbar, you can't just type it.
Sep 14, 2016
08:41 AM
- Mark as New
- Bookmark
- Subscribe
- Mute
- Subscribe to RSS Feed
- Permalink
- Notify Moderator
Please log in to access translation
Sep 14, 2016
08:41 AM
Thanks for the help, that worked great!
Sep 14, 2016
04:12 AM
- Mark as New
- Bookmark
- Subscribe
- Mute
- Subscribe to RSS Feed
- Permalink
- Notify Moderator
Please log in to access translation
Sep 14, 2016
04:12 AM
There are more roads that lead to Rome...
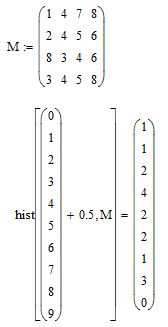
Hist will count the number of elements of its second argument (M in this case), that are within the intervals as described by its first argument (the vector with elements 0 through 9, note that 0.5 is added to each element of this vector).
From the help:
hist(intvls,data) Returns a histogram of data - a vector representing the frequencies with which values in data fall into the intervals represented by intvls.
Note that this method will count 1.1 as well as 0.9 in the bin for 1's, like wise for the other numbers.
Success!
Luc
Sep 14, 2016
04:16 AM
- Mark as New
- Bookmark
- Subscribe
- Mute
- Subscribe to RSS Feed
- Permalink
- Notify Moderator
Please log in to access translation
Sep 14, 2016
04:16 AM
And then there's this:

histogram(intvls,data) Returns a matrix with two columns. The first column contains midpoints of the n subintervals of the range min(A) <= value <= max(A) of equal length. The second column is identical to hist(n, A), and hence the resulting matrix has n rows. Using histogram rather than hist saves you the additional step of defining horizontal axis data when plotting.
Luc
Sep 14, 2016
06:19 AM
- Mark as New
- Bookmark
- Subscribe
- Mute
- Subscribe to RSS Feed
- Permalink
- Notify Moderator
Please log in to access translation
Sep 14, 2016
07:34 AM
- Mark as New
- Bookmark
- Subscribe
- Mute
- Subscribe to RSS Feed
- Permalink
- Notify Moderator
Please log in to access translation
Sep 14, 2016
07:34 AM
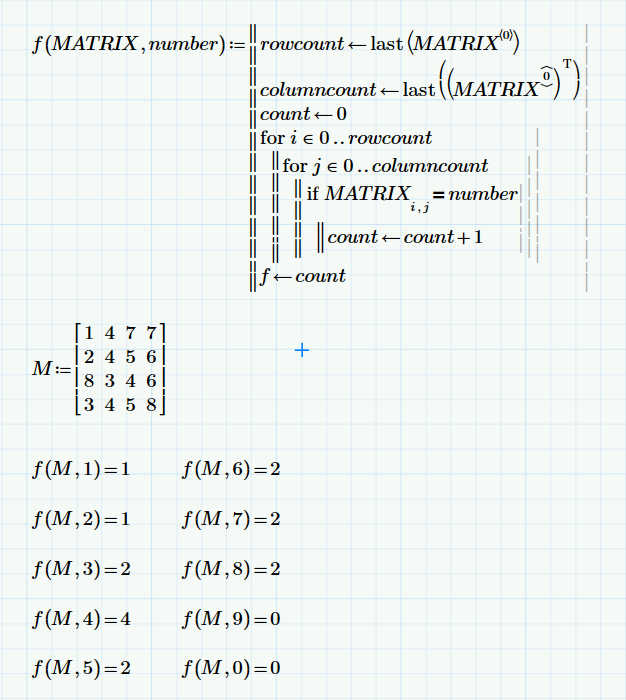
Looks like we are going to collect differnt ways and methods to achieve the same result.
So here is another piece for that collection

Guess we could also combine Stuarts "unravel" with the vector sum operator.
Nevertheless I would vote for Richards approach - nice and tidy 😉
Werner


