Community Tip - Learn all about the Community Ranking System, a fun gamification element of the PTC Community. X
- Subscribe to RSS Feed
- Mark Topic as New
- Mark Topic as Read
- Float this Topic for Current User
- Bookmark
- Subscribe
- Mute
- Printer Friendly Page
Creating a 3d separation plan on a 3d scatter plot
- Mark as New
- Bookmark
- Subscribe
- Mute
- Subscribe to RSS Feed
- Permalink
- Notify Moderator
Creating a 3d separation plan on a 3d scatter plot
I have been doing some classification style worksheets that separate tow data sets with a hyperplane.
Plotting the two data sets in 3d with a scatter plot and two colours for the data points is relatively easy.
I now have a separating hyperplane in the form w.x=0, where x[0 is unity, so w[0 is the intercept.
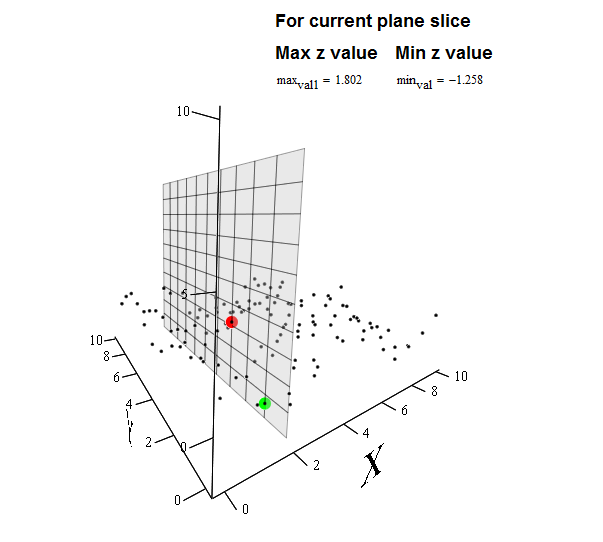
What is the neatest, best way of creating and displaying the 3d separating hyper-plane based on the above formulation. I'm happy to apply transparency to the plane, but creating the right 'mesh' has eluded me.
It would be desirable if the size of the hyperplane didn't cause the scatter plot to significantly re-size.
Thoughts?
I'm running V14/15. stuff that works on V11 would be good to.
Philip
- Labels:
-
Statistics_Analysis
- Mark as New
- Bookmark
- Subscribe
- Mute
- Subscribe to RSS Feed
- Permalink
- Notify Moderator
Hi Phillip,
Not sure I fully understand what you mean by a separating hyper-plane.
Below is something I put together to show cloud data (experimental) and how the data can be sliced at a particular plane to identify max/min values with a single scatter data set.
.

I can share the worksheet (v14/15) if its close to what you require.
Best regards,
Thomas
- Mark as New
- Bookmark
- Subscribe
- Mute
- Subscribe to RSS Feed
- Permalink
- Notify Moderator
Thomas, Yes a working sheet would be useful.
In my case I have the weight vector to the normal to the hyperplane, and it's intercept.
The problem is in making the inserted plane the right size / extent so that the overall image auto-zooms to the right size.
- Mark as New
- Bookmark
- Subscribe
- Mute
- Subscribe to RSS Feed
- Permalink
- Notify Moderator
Hi Philip,
Here is the file.
I used some functions from the ebook "Creating Amazing Images with Mathcad 14" created by Byrge Birkeland.
There are a wealth of useful functions he has built in there.
You can find it here if interested http://communities.ptc.com/community/mathcad/mathcad-usage/blog/2010/05/27/creating-amazing-images-with-mathcad-14
Hope it helps.
Regards,
Thomas


