Community Tip - Stay updated on what is happening on the PTC Community by subscribing to PTC Community Announcements. X
- Subscribe to RSS Feed
- Mark Topic as New
- Mark Topic as Read
- Float this Topic for Current User
- Bookmark
- Subscribe
- Mute
- Printer Friendly Page
Creating a vector field plot
- Mark as New
- Bookmark
- Subscribe
- Mute
- Subscribe to RSS Feed
- Permalink
- Notify Moderator
Creating a vector field plot
I am trying to create a vector field plot following the instruction on the Mathcad 15 help.
I used the example for the case of two matrices.


But the matrices have a suffix (I used 3 and 2 above respectively), this suffix number is not explained on the example for the Mathcad 15 help.
Can someone tell me what the suffixes mean?
thank you in advance,
Rogelio
- Labels:
-
Other
- Mark as New
- Bookmark
- Subscribe
- Mute
- Subscribe to RSS Feed
- Permalink
- Notify Moderator
I'm Mathcadless at the moment, so can't say precisely why you're seeing 2 and 3, however ...
F is an example of what is referred to a nested array, that is, each of its elements is itself an array. In this particular case, each element is a vector. So the expression first gets the contents of F's element (i,j) and then gets element 2 or 3 of the resulting vector.
There is no reason in principle why a nested array's elements themselves could not nested arrays, and so on.
Stuart
- Mark as New
- Bookmark
- Subscribe
- Mute
- Subscribe to RSS Feed
- Permalink
- Notify Moderator
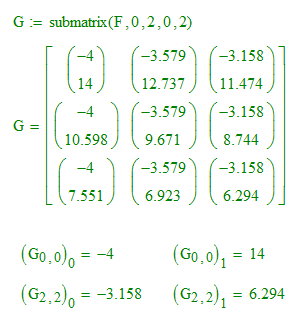
The function V returns a two element vector as a function of x any y (i.e at each coordinate x,y there is a vector, not a scalar, value). So each element of F is a two element vector, in which the first element is the x component of the vector, and the second element is the y component of the vector. As Stuart notes, that means F is a nested array. To create the vector field plot the x components and y components need to be separated into two matrices. So this:

(indices 0 and 1, not 3 and 2, as your show) splits the first and second elements of each vector at coordinate i,j into tow separate matrices.
Edit: Perhaps this will help. This is the top left corner of the matrix F:

- Mark as New
- Bookmark
- Subscribe
- Mute
- Subscribe to RSS Feed
- Permalink
- Notify Moderator
I think that I got it.
Thank you very much.


