Community Tip - When posting, your subject should be specific and summarize your question. Here are some additional tips on asking a great question. X
- Subscribe to RSS Feed
- Mark Topic as New
- Mark Topic as Read
- Float this Topic for Current User
- Bookmark
- Subscribe
- Mute
- Printer Friendly Page
Curve fitting using straight lines.
- Mark as New
- Bookmark
- Subscribe
- Mute
- Subscribe to RSS Feed
- Permalink
- Notify Moderator
Curve fitting using straight lines.
How to execute Minimize() function to get the slope and intercept for the straight lines?
Solved! Go to Solution.
- Labels:
-
Statistics_Analysis
Accepted Solutions
- Mark as New
- Bookmark
- Subscribe
- Mute
- Subscribe to RSS Feed
- Permalink
- Notify Moderator
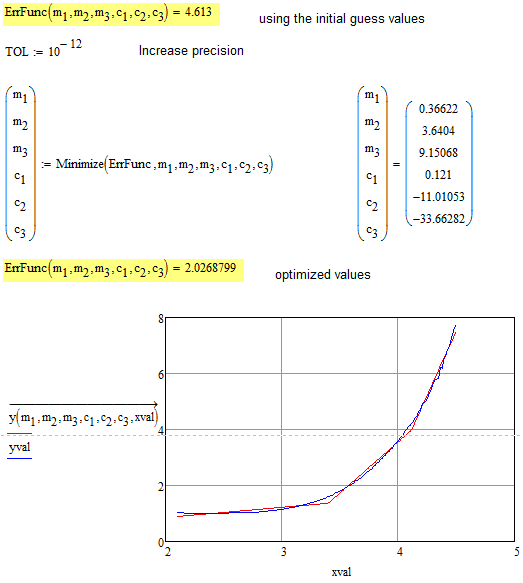
Loi Cheng Poon wrote: How to execute Minimize() function to get the slope and intercept for the straight lines?
You have not shown in your sheet what you tried to get the optimal parameters, so I don't know if you used minimize() in an incorrect way or you simply struggled because Minimize() won't change any of the parameters.
The latter case happens when you try to minize in your sheet - minize would spit out the guess values without changing any. The reson for this are the huge x values. The numeric algorith would change them slighty(!!) but the ErrFunc will shoe no noticeable change within the given tolerance value. So minimize() decides that the fit is already good enough. Decreasing the value of TOL (or even CTOL ?) does not help in your case.
So one way out is to scale your data (multiply every x value by 10^-9 and of course you would have to multiply ever slope guess by 10^9). Doing so enables minimize() to find a better fit and decreasing the value of TOL even gives you a slight improvement. You may now multiply the slopes found by 10^-9 to get the appropriate values for your data.
I also tried an approach using minerr() (again with the scaled data) but it takes a bit more time to calculate and the fit is slightly worse. Changing TOL or CTOL does not change the result here.

- Mark as New
- Bookmark
- Subscribe
- Mute
- Subscribe to RSS Feed
- Permalink
- Notify Moderator
Sort your data into the ranges you want to fit. Then the functions "line", or "slope", and "intercept" will do a leaast squares fit.
- Mark as New
- Bookmark
- Subscribe
- Mute
- Subscribe to RSS Feed
- Permalink
- Notify Moderator
Fred Kohlhepp wrote:
Sort your data into the ranges you want to fit. Then the functions "line", or "slope", and "intercept" will do a leaast squares fit.
I guess that this is not exactly what Loi Cheng Poon is looking for. When using the built in linear regression you would have to split the x range in three parts yourself and you don't know where the optimal two points for splitting are. Furthermore the three line segements would not be contiguous and it seems to me from the example provided that this is mandatory.
- Mark as New
- Bookmark
- Subscribe
- Mute
- Subscribe to RSS Feed
- Permalink
- Notify Moderator
Loi Cheng Poon wrote: How to execute Minimize() function to get the slope and intercept for the straight lines?
You have not shown in your sheet what you tried to get the optimal parameters, so I don't know if you used minimize() in an incorrect way or you simply struggled because Minimize() won't change any of the parameters.
The latter case happens when you try to minize in your sheet - minize would spit out the guess values without changing any. The reson for this are the huge x values. The numeric algorith would change them slighty(!!) but the ErrFunc will shoe no noticeable change within the given tolerance value. So minimize() decides that the fit is already good enough. Decreasing the value of TOL (or even CTOL ?) does not help in your case.
So one way out is to scale your data (multiply every x value by 10^-9 and of course you would have to multiply ever slope guess by 10^9). Doing so enables minimize() to find a better fit and decreasing the value of TOL even gives you a slight improvement. You may now multiply the slopes found by 10^-9 to get the appropriate values for your data.
I also tried an approach using minerr() (again with the scaled data) but it takes a bit more time to calculate and the fit is slightly worse. Changing TOL or CTOL does not change the result here.


