
Turn on suggestions
Auto-suggest helps you quickly narrow down your search results by suggesting possible matches as you type.
Showing results for
Please log in to access translation
Turn on suggestions
Auto-suggest helps you quickly narrow down your search results by suggesting possible matches as you type.
Showing results for
Community Tip - You can change your system assigned username to something more personal in your community settings. X
Translate the entire conversation x
Please log in to access translation
Options
- Subscribe to RSS Feed
- Mark Topic as New
- Mark Topic as Read
- Float this Topic for Current User
- Bookmark
- Subscribe
- Mute
- Printer Friendly Page
DATA EXTRACTION
Mar 09, 2013
03:22 PM
- Mark as New
- Bookmark
- Subscribe
- Mute
- Subscribe to RSS Feed
- Permalink
- Notify Moderator
Please log in to access translation
Mar 09, 2013
03:22 PM
DATA EXTRACTION
Hello,
Please see the attached MathCad 15 worksheet.
I am trying to extract the data for Figs. 8, 9, 10(a) and 10(b). Y won't let me to do this.
Could anyone help and let me know the way I can extract the data for the graphs?
I am transferring data to EXCEL to plot more aesthetics looking graphs.
In the worksheet, I have indicated the graphs and the data associated with them.
Thank you so much,
Anousheh
Solved! Go to Solution.
Labels:
- Labels:
-
Statistics_Analysis
ACCEPTED SOLUTION
Accepted Solutions
Mar 09, 2013
07:44 PM
- Mark as New
- Bookmark
- Subscribe
- Mute
- Subscribe to RSS Feed
- Permalink
- Notify Moderator
Please log in to access translation
Mar 09, 2013
07:44 PM
Again - you had not defined different vectors Y, therefore the crippled graphs as some need higher values of Y.
I think you will find the attched useful.
I have written a routine to create a table with the abscissa and ordinate values as first and second column. You can extract them as single vector using the rowselector (Strg-6).
The 6 parameters of the routine allow selection of the two functions for abscissa and ordinate, rho, start and end value of Y and the number of points (= size of the resulting vectors) to allow for more details.
I guess you could now chose the same higher value for Y-end (second but last parameter) as I have rewritten your function, especially function X, which now returns NaN if the integral does not convert (the reason for the errors in some of your prior sheets).
Furthermore the graphs evaluate much quicker now, even if you increase the number of points.
13 REPLIES 13
Mar 09, 2013
04:15 PM
- Mark as New
- Bookmark
- Subscribe
- Mute
- Subscribe to RSS Feed
- Permalink
- Notify Moderator
Please log in to access translation
Mar 09, 2013
04:15 PM
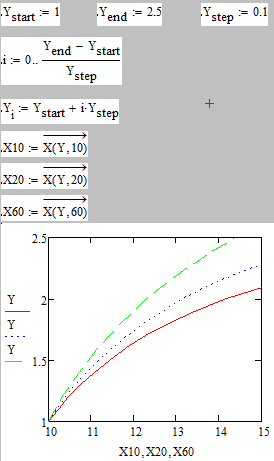
Mathcad can not evaluate X(Y,10) if you don't tell it what Y should be. This works for quickplots, where Mathcad automaticaly creates a range variable Y for you. So as you want vectors to export to Excel, you will have define Y as a vector (you have to know which range). The vectorization I did just for safety, as far as I see it would not be necessary with the functions you have defined.
Y, X10, X20 and X60 are now vectors you can export (and use for plot in MC, too).
Mar 09, 2013
04:25 PM
- Mark as New
- Bookmark
- Subscribe
- Mute
- Subscribe to RSS Feed
- Permalink
- Notify Moderator
Please log in to access translation
Mar 09, 2013
04:25 PM
Hello Werner,
Thanks.
Could you please attach the worksheet for me? Thank you,
Anousheh
Mar 09, 2013
04:37 PM
- Mark as New
- Bookmark
- Subscribe
- Mute
- Subscribe to RSS Feed
- Permalink
- Notify Moderator
Please log in to access translation
Mar 09, 2013
04:37 PM
Anousheh Rouzbehani wrote:
Hello Werner,
Thanks.
Could you please attach the worksheet for me? Thank you,
Anousheh
Oops, sorry. Thats what I intended to do but forgot.
Unfortunately I didn't keep the worksheet, its gone. But I think it would not be that difficult for you to recreate from the image I included.
Mar 09, 2013
04:44 PM
- Mark as New
- Bookmark
- Subscribe
- Mute
- Subscribe to RSS Feed
- Permalink
- Notify Moderator
Please log in to access translation
Mar 09, 2013
04:44 PM
Hello Werner,
Thank you. I don't know why I get this:
Perhaps, it would help if you attach the file for me. I have included the original one here.
Thank you,
Anousheh
Mar 09, 2013
04:47 PM
- Mark as New
- Bookmark
- Subscribe
- Mute
- Subscribe to RSS Feed
- Permalink
- Notify Moderator
Please log in to access translation
Mar 09, 2013
04:47 PM
Hi,
I just did copy and paste the error section in the worksheet. It appeared OK, but when I posted, it disappeared!
Don't know why?!
Anousheh
Mar 09, 2013
05:31 PM
- Mark as New
- Bookmark
- Subscribe
- Mute
- Subscribe to RSS Feed
- Permalink
- Notify Moderator
Please log in to access translation
Mar 09, 2013
05:31 PM
I'm not sure what I should see!? It seems to be the same worksheet as you original posted.
Mar 09, 2013
05:37 PM
- Mark as New
- Bookmark
- Subscribe
- Mute
- Subscribe to RSS Feed
- Permalink
- Notify Moderator
Please log in to access translation
Mar 09, 2013
05:37 PM
Hello Werner,
Yes. But I can not get the thing work. I have followed your instructions.
In Fig. 9 I can plot 3 curves with no problem, but when I insert some constant on the vertical axis to get horizontal lines at those values, nothing happens.
So, I am attaching the worksheet for you to see.
Please tell me why I cannot increase the end limit from 2.5 to let's say 3?
Thanks,
Anousheh
Mar 09, 2013
05:48 PM
- Mark as New
- Bookmark
- Subscribe
- Mute
- Subscribe to RSS Feed
- Permalink
- Notify Moderator
Please log in to access translation
Mar 09, 2013
05:48 PM
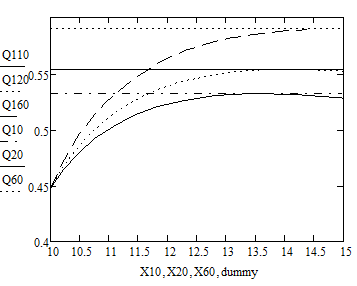
I see. X60, Q160, are vector. If you plot one vector against another, you are plotting the points which correspond to the vector elements. On your abscissa you have 3 vectors, but on th ordinate you have 6 expressions. So the last three share tha last one on the abscissa. Basically for the last three "plots" you have a vector at the absicissa (X60) and a single, constant value on the ordinate - that can not work.
Solution 1: Make Q10, etc. a vector with as many elelments as X60 (all the same)
Solution 2: (By far the better one 😉 spend the absicissa at least one dummy variable (rename it, please) and enjoy Mathcads quickplot feature. See below:
Mar 09, 2013
06:08 PM
- Mark as New
- Bookmark
- Subscribe
- Mute
- Subscribe to RSS Feed
- Permalink
- Notify Moderator
Please log in to access translation
Mar 09, 2013
06:08 PM
Hello again Werner,
Thank you so much for the time.
Please see the attached worksheet. I followed your instructions.
Almost works. Please see the graphs with partial fills. I tried to increase the end limit, but I couldn't.(e.g. 2.75)
Thank you,
Anousheh
Mar 09, 2013
06:15 PM
- Mark as New
- Bookmark
- Subscribe
- Mute
- Subscribe to RSS Feed
- Permalink
- Notify Moderator
Please log in to access translation
Mar 09, 2013
06:15 PM
You will need more than one vector Y, depending an which graph you plot, because some graphs simply end too soon with the Y you have chosen.
I think it would be a good idea to include an "on error" in the definition of X, to return NaN if the integral does not converge.
Mar 09, 2013
07:14 PM
- Mark as New
- Bookmark
- Subscribe
- Mute
- Subscribe to RSS Feed
- Permalink
- Notify Moderator
Please log in to access translation
Mar 09, 2013
07:14 PM
Hello Werner,
Thanks a lot. I cannot sort this out. Could you please do this for me.
I have attached the worksheet that I could do as much.
Thank you again,
Anousheh
Mar 09, 2013
07:44 PM
- Mark as New
- Bookmark
- Subscribe
- Mute
- Subscribe to RSS Feed
- Permalink
- Notify Moderator
Please log in to access translation
Mar 09, 2013
07:44 PM
Again - you had not defined different vectors Y, therefore the crippled graphs as some need higher values of Y.
I think you will find the attched useful.
I have written a routine to create a table with the abscissa and ordinate values as first and second column. You can extract them as single vector using the rowselector (Strg-6).
The 6 parameters of the routine allow selection of the two functions for abscissa and ordinate, rho, start and end value of Y and the number of points (= size of the resulting vectors) to allow for more details.
I guess you could now chose the same higher value for Y-end (second but last parameter) as I have rewritten your function, especially function X, which now returns NaN if the integral does not convert (the reason for the errors in some of your prior sheets).
Furthermore the graphs evaluate much quicker now, even if you increase the number of points.
Mar 09, 2013
08:41 PM
- Mark as New
- Bookmark
- Subscribe
- Mute
- Subscribe to RSS Feed
- Permalink
- Notify Moderator
Please log in to access translation
Mar 09, 2013
08:41 PM
Hello Werner,
Thank you.
I appreciate this very much. Everything works perfectly.
Have a wonderful day.
All the best,
Anousheh
PS My paper is coming to a very nice conclusion.


