- Subscribe to RSS Feed
- Mark Topic as New
- Mark Topic as Read
- Float this Topic for Current User
- Bookmark
- Subscribe
- Mute
- Printer Friendly Page
Data processing
- Mark as New
- Bookmark
- Subscribe
- Mute
- Subscribe to RSS Feed
- Permalink
- Notify Moderator
Data processing
Hello community!
In the solution of the problem of processing the experimental data, I had a some problem. Comments to my solution I have given in the attached file. I use Mathcad 15 M020. Any help would be useful.
Solved! Go to Solution.
- Labels:
-
Statistics_Analysis
Accepted Solutions
- Mark as New
- Bookmark
- Subscribe
- Mute
- Subscribe to RSS Feed
- Permalink
- Notify Moderator
So it seems the sheet does what you demand, isn't it?
I think I forgot to attach the worksheets themselves last time - here they are.
- Mark as New
- Bookmark
- Subscribe
- Mute
- Subscribe to RSS Feed
- Permalink
- Notify Moderator
Could you elaborate more precise what you try (cycling) between Plot 2 and Plot 3? How do you define amplitude and minimal amplitude in case of your data? The minimum delta you calculate is only from the difference max_i - min_i, but max_i-min_i+1 (going from a local max down to the next local min) could yield an even smaller result - not relevant?
And what should the resulting vectors Number/Min/Max represent?
Number seems to be a simple sequence, Max consists is the sorted vector Maximum with NaN replaced by the smallest number 12?
Anmd Min - no clue.
- Mark as New
- Bookmark
- Subscribe
- Mute
- Subscribe to RSS Feed
- Permalink
- Notify Moderator
Thank you for your reply, Werner.
Werner Exinger wrote:
Could you elaborate more precise what you try (cycling) between Plot 2 and Plot 3?...
I hope the following screenshot could help:
Step 1:
Step 2:
Step 2 with the table:
Step 3:
Werner Exinger wrote:
How do you define amplitude and minimal amplitude in case of your data? The minimum delta you calculate is only from the difference max_i - min_i, but max_i-min_i+1 (going from a local max down to the next local min) could yield an even smaller result - not relevant?
Amplitude = Max - Min;
min(Amplitude) = Minimum from all set of "Amplitude".
- Mark as New
- Bookmark
- Subscribe
- Mute
- Subscribe to RSS Feed
- Permalink
- Notify Moderator
It seems to me that at the end everytime you would arrive at two values which could have been calculated simply by max(maximum) and min(minimum) from the very beginning. Or what am I missing.
Or are you utilizing those intermediate data (the values you cut out of the graph in every step). Yes, that seems to be the point, otherwise it would be too easy.
Some more questions:
1) The cycling ends when ... see later
2) Is guaranteed that the second datapoint is greater than the first? In your file you assumed that as you assumed that the number of maxima is equal or one less than the number of minima.
3) One thing I still don't understand is, why you are interested in the difference (amplitude) of the ascending part of the graph only and not the desvending one.
As far as I understood your algorithm: You look for the ascending line segment with the smallest (vertcal) difference, put the two values in your numbered exit-table and then delete those points from the data set. If there are more than one segments with the same minimal diff you take the first. Sometimes you will have to remove the very first linesegment that way. So every time you remove one minimum and one maximum.
You iterate this until only two minima and one maximum (plus NaN) is left.!? But what, if the number of min and max is equal. When do you stop now?
You are only interested in the minimum of the ascending segment even if a descending segment would have a smaller difference (as in the following example).
Lets see if I got it right. With the data I have chosen, would the following be right or what would be the disired outcome (your routine fails on that data set, probably because the minimum is the very first segment):
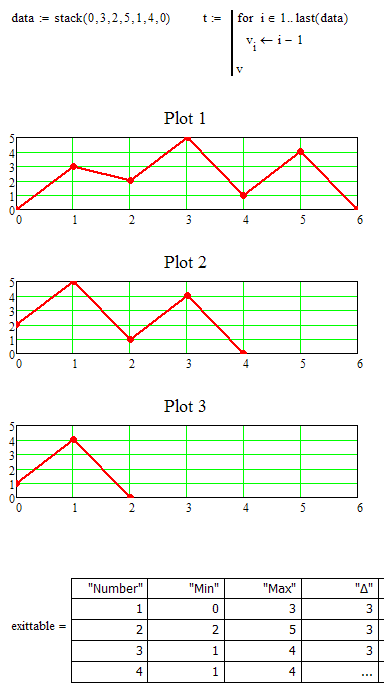
Your exit table would end after line 3, does it?
I think a recursive function would do the job, but first I have to be absolutely sure what you want to achieve. On second thought - as we know the number of iterations it could be easier.
- Mark as New
- Bookmark
- Subscribe
- Mute
- Subscribe to RSS Feed
- Permalink
- Notify Moderator
Werner,
Some comments on given by you example:
1. Every time we start from left to right and look for the minimum amplitude (Amplitude = Max - Min), as long as there will be three points and then stop ((minimum), (maximum), (minimum); this values of min/max entered last in the exit table). If the amplitudes are equal, then we cut the very first of them (cut one minimum and one maximum) going, with, from left to right.
2. When at some value we started at that value we have to finish (in your example, this is "0") each time the of data reconstruction after cuttting. And in the end we have only 3 points (min(frome all data), max (frome all data), min (from all data)). When our data will have only three values then cycling ends.
3. Amplitude must be between the two lines.
Comment:

Right solution:

Exit table for example must be like this:
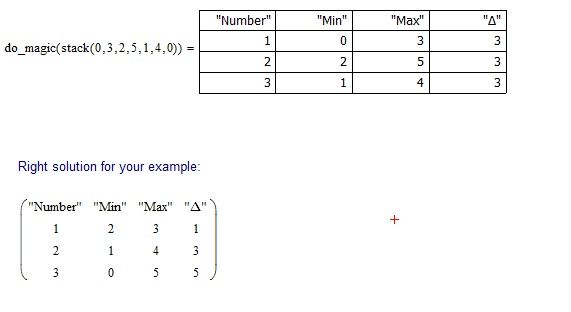
- Mark as New
- Bookmark
- Subscribe
- Mute
- Subscribe to RSS Feed
- Permalink
- Notify Moderator
User User schrieb:
???
Werner,
Some comments on given by you example:
So you shed some light on the situation. I was forced to orient myself at your cycle program and that program included the first and the last Max-Min difference and would try to remove the first two points, too (it fails, as of an index error). Although your cycle routine only compared Max1-Min1 (which it should't, as the first point must not be deleted), Max2-Min2, Max3-Min3, etc.but not Max1-Min2, Max2-Min3, etc. As I understand it should have done so as you want to remove descending segments as well as ascending.
1. Every time we start from left to right and look for the minimum amplitude (Amplitude = Max - Min), as long as there will be three points and then stop ((minimum), (maximum), (minimum);
Unless you add an additional condition about the valiues of your data it could as well be ((maximum),(minimum),(maximum)) if the second data value is smaller than the first one. Lets begin with (5, 0, 10, 3 ,5) you will end with (5,0,5) which is max,min,max.
2. When at some value we started at that value we have to finish (in your example, this is "0") each time the of data reconstruction after
This is only because you force your data to begin and end with the same value. I still think its somewhat crude to replace the original last value by the first one. If the data should have this behaviour because its periodic e.g. but hasn't as of measurement errors, I believe it would be better to replace both the first and last value by the arithmetic mean of both or to append the first value at the end of the data vector. But that depends upon what the data represents for you. You will know whats appropriate.
And in the end we have only 3 points (min(frome all data), max (frome all data), min (from all data)).
NO - you end up with the start/end value (which has not to be min or max of all data) twice and a third value in the center, which is either max(all data) OR min(all data), depending on whether the second data value is greater or smaller as the first one.
With (5,10,0,7,5) you and up with (5,10,5) the boundary value and the absolute max of the data - the absolute min (0) is gone, while with (5, 0, 10, 3 ,5) you end up at (5,0,5), again the boundary value plus the absolute min of the data - this time the absolute max is gone.
3. Amplitude must be between the two lines.
I understand that you don't want to remove the endpoints resp the end line segments. That way two of the three values left at the end of the iteration process will be exactly those equal border values.
Will see to find time to rewrite my sheet according to the new conditions.
Werner
Message edited: What should happen if the number of datapoints in the vector extremum is an even number. As you take away two point with every step of iteration, you would either stop at 4 or at 2(the borders) points. What is the las line in the exit-table?
An example: (5,7,6,8,3,5) would yield (5,8,3,5) and then? (5,5)??
The exit table being
| Nr | Min | max | Delta |
|---|---|---|---|
| 1 | 6 | 7 | 1 |
| 2 | 3 | 8 | 5 |
| 3 | 5 | 5 | 0 |
????
- Mark as New
- Bookmark
- Subscribe
- Mute
- Subscribe to RSS Feed
- Permalink
- Notify Moderator
So, if we consider your suggestion examples, then first, the data needs to be rearranged so that the cycle starts with the maximum peak or the minimum valley, whichever is greater in absolute magnitude. In example below, the highest peak with a magnitude of 12 occurs first as opposite to the lowest valley and is therefore chosen as the beginning point for the rearranged data. The new data which shown also below is generated by cutting all the points prior to and including the highest peak and by appending these data to the end of the original data. An additional highest peak is included in the new data to close the largest loop for conservatism.
Data:
New rearranged data:
- Mark as New
- Bookmark
- Subscribe
- Mute
- Subscribe to RSS Feed
- Permalink
- Notify Moderator
Hmm, what a change of mind - so it seems you are not quite sure about the algorithm to choose to achieve whatever you want.
As I have no clue what the sense of that iteration would be and what task you are working on in the end, I was just poking around a bit and found some things which were irritating me (like abandon the last point or the problems you run in with an even number of local extremas).
I think these problems are handled pretty well by the rearrangement you suggest.
Could you explain what the deeper sense of that whole procedure would be - in as much could that exit-table be of any value? Sure you are not just seeking the difference of the absolute maximum and minimum. Are you really sure about the new algorithm now?
Despite that change in algorithm find attached the new worksheet which covered the conditions stated so far. The results are consistent with yours now. The new rearrangement (I guess it would not matter if its done on the original data or later on the extrema vector) is not covered yet but should not be that diffucult.
Werner
Edited: There is still one problem. If two or more consecutive points have the same value, this is not recognized as local min or max and therefore removed. Guess this should not happen. So beforehand one would have to remove all of these equal values but one.
- Mark as New
- Bookmark
- Subscribe
- Mute
- Subscribe to RSS Feed
- Permalink
- Notify Moderator
Werner Exinger wrote:
It seems to me that at the end everytime you would arrive at two values which could have been calculated simply by max(maximum) and min(minimum) from the very beginning. Or what am I missing.
Or are you utilizing those intermediate data (the values you cut out of the graph in every step).
Yes, this is correct. Finally we come to the max (maximum) and min (minimum), which can be determined before processing. The condition of the correctness of the final program will be that column for the "delta" should contain the increasing elements and last element in this column must to be the maximum amplitude (max (delta)).
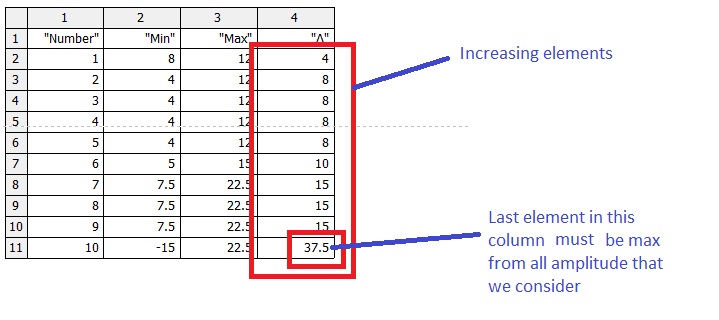
I use these intermediate data (values of min and max, cuted from the graph/our data at each step) for the next calculation of the equivalent load. Initial data represent load-time history. Some methods of processing this data can be found in the following standard: "DDR-Standards TGL 33787 (Schwingfestigkeit. Regellose Zeitfunktion. Statistische Auswertung)". I want to write a program to process the data by using my modified method.
- Mark as New
- Bookmark
- Subscribe
- Mute
- Subscribe to RSS Feed
- Permalink
- Notify Moderator
So it seems the sheet does what you demand, isn't it?
I think I forgot to attach the worksheets themselves last time - here they are.
- Mark as New
- Bookmark
- Subscribe
- Mute
- Subscribe to RSS Feed
- Permalink
- Notify Moderator
Thank you for your help, Werner!
P.S. I just need some time to think about what i need to do (some condition) with a last element in initial data.
- Mark as New
- Bookmark
- Subscribe
- Mute
- Subscribe to RSS Feed
- Permalink
- Notify Moderator
Werner Exinger wrote:
...And what should the resulting vectors Number/Min/Max represent?
Number seems to be a simple sequence, Max consists is the sorted vector Maximum with NaN replaced by the smallest number 12?
Anmd Min - no clue.
In fact, in the final table, we need only "Max" and "Min", which shall be placed in the table every time we rearrange our data and create new plot after the next cut of the smallest amplitude (amplitude = Max - Min; and each time these values of Max and Min are recorded in the table).
- Mark as New
- Bookmark
- Subscribe
- Mute
- Subscribe to RSS Feed
- Permalink
- Notify Moderator
In fact, in the final table, we need only "Max" and "Min", which shall be placed in the table every time we rearrange our data
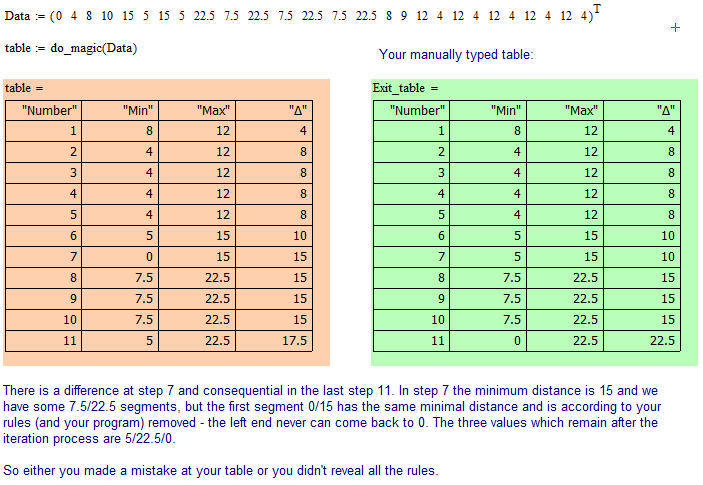
Ok, thats no so difficult. But I think you did not reveal all rules which have to applied. See the attached file and my annotations.
- Mark as New
- Bookmark
- Subscribe
- Mute
- Subscribe to RSS Feed
- Permalink
- Notify Moderator
Hi Werner!
Thank you for your help and your time. I started to view your worksheet and gradually will to comment.
- Mark as New
- Bookmark
- Subscribe
- Mute
- Subscribe to RSS Feed
- Permalink
- Notify Moderator
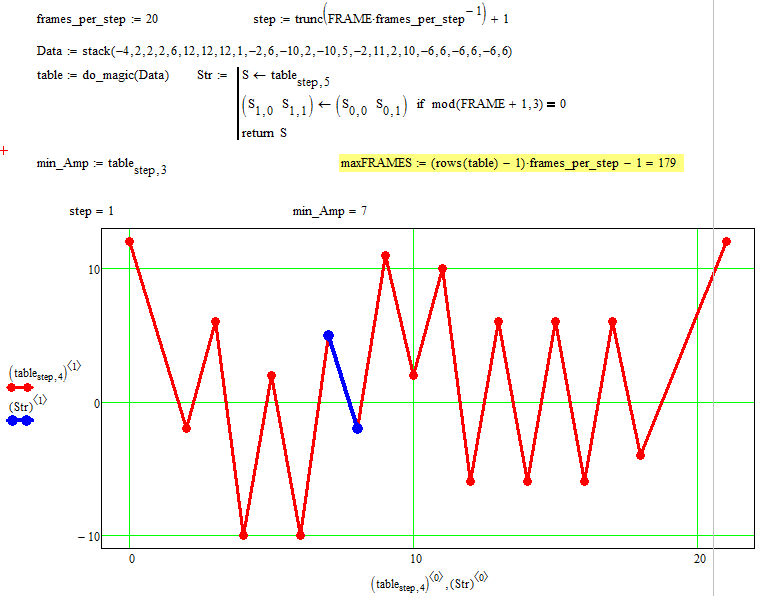
OK, the new specifications with the splitting and rearranging of the data at the first absolute extrema was easy to implement as was the adressing of the problem with sequences of equal valued data (http://communities.ptc.com/message/195434#195434). Theorde was important, first splt and rearrange, then eliminate the duplicates in series.
Have modified the routine to return for every step the rearranged and processed data and the linesegment to be discarded. Can be used for step by step graphing or making an animation (see attached).
- Mark as New
- Bookmark
- Subscribe
- Mute
- Subscribe to RSS Feed
- Permalink
- Notify Moderator
Nice animation, especially the way you make the blue line blink. Thanks for the screenshot which reveals how you did it - cute!
But what are we expected to see here? What's shown by that elimination process?
The outcome seems to be clear from the very beginning (highest and lowes points).
Thanks, never did that blinking thing before but its not that hard to come by. Find attached a slightly modified ani.
According to what the deeper sense of all that is: The animation was not part of the original posers question, just a playing around which shows the process of elimination step by step. I guess the real data this process is intended for would be far to large for an animation to make sense, but then I may be wrong. The thing the poster was after is the table created by my program which basically includes for each elimination step the values of the two removed data points.IIf you read the whole thread you will see that I myself had asked the question after the sense before. The poster was not around for a while but maybe he will reveal the secret sometime.
- Mark as New
- Bookmark
- Subscribe
- Mute
- Subscribe to RSS Feed
- Permalink
- Notify Moderator
Werner Exinger wrote:
...The poster was not around for a while but maybe he will reveal the secret sometime...
I'll give a real example when we finish this program.
- Mark as New
- Bookmark
- Subscribe
- Mute
- Subscribe to RSS Feed
- Permalink
- Notify Moderator
Guest2 wrote:
...But what are we expected to see here? What's shown by that elimination process?
The outcome seems to be clear from the very beginning (highest and lowes points)...
You can find my answer in this reply: http://communities.ptc.com/message/195693#195693
- Mark as New
- Bookmark
- Subscribe
- Mute
- Subscribe to RSS Feed
- Permalink
- Notify Moderator
Thank you for this animation, Werner.
- Mark as New
- Bookmark
- Subscribe
- Mute
- Subscribe to RSS Feed
- Permalink
- Notify Moderator
Connells 70 schrieb:
Thank you for this animation, Werner.
Nothing to thank for.
The animation data sheet are in version 5 of the sheet. I think version 4 will be more valuable for you, hope it helps. I posted both somewhere in this thread but I'm beginning loosing track.
Good luck for your project!
Werner
- Mark as New
- Bookmark
- Subscribe
- Mute
- Subscribe to RSS Feed
- Permalink
- Notify Moderator
Werner Exinger wrote:
...I think version 4 will be more valuable for you...
But why? I work with version 5 because i would like to see animation step by step. And both worksheets version (4 and 5) give same results in the exit table.
Werner Exinger wrote:
..I posted both somewhere in this thread but I'm beginning loosing track...
They can be found in this post: http://communities.ptc.com/message/195796#195707
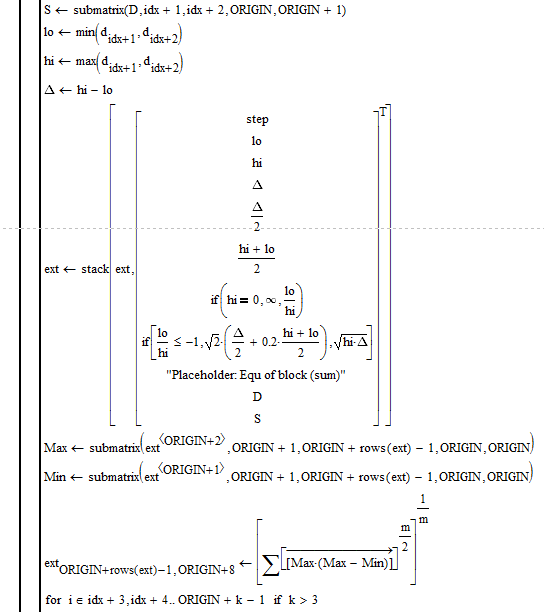
So it seems that I don't need the following program line (which showed below) in routine anymore (I added this new line code just for checking)?
- Mark as New
- Bookmark
- Subscribe
- Mute
- Subscribe to RSS Feed
- Permalink
- Notify Moderator
But why? I work with version 5 because i would like to see animation step by step. And both worksheets version (4 and 5) give same results in the exit table.
Yes, of course. I didn't change anything in the core routine, just added the output of the two arrays in the table. The reason I thought you would rather stay with v4 was because I guessed you would have to deal with rather large data vectors and so the animation would not make much sense and calculation is slowed down by the additions. But if you like my baublery and can use it, fine, do it.
So it seems that I don't need the following program line (which showed below) in routine anymore (I added this new line code just for checking)?
Yes, I think you can delete it. I split the data vector in two using submatrix and combine the results in reverse order using stack in one line. I split them in such a way at the point of the first extrema that this extrema is included in both subvectors as last/first point. That way automatically the first and last values of the new combined vector iare equal. The line you added does no harm but should never be necessary.
- Mark as New
- Bookmark
- Subscribe
- Mute
- Subscribe to RSS Feed
- Permalink
- Notify Moderator
Hi Werner,
1. I want to add some new rows to a exit table and I cannot add them all on your program routine. I attached the file, you'll find my comments there.
Werner Exinger wrote:
Note that I set ORIGIN back to 0.
2. But your program routine works independently of the set of ORIGIN? So It does not matter from what ORIGIN I start (with 0 or 1), that's right?
Thanks.
- Mark as New
- Bookmark
- Subscribe
- Mute
- Subscribe to RSS Feed
- Permalink
- Notify Moderator
ad 1) whats the specific problem in adding additional data? Do you really mean rows or rather columns?
ad 2) yes, i hope my routine is ORIGIN-aware throughout. Just thought I should point out that fact.
- Mark as New
- Bookmark
- Subscribe
- Mute
- Subscribe to RSS Feed
- Permalink
- Notify Moderator
Werner Exinger wrote:
ad 1) whats the specific problem in adding additional data? Do you really mean rows or rather columns?
I mean that I want to add some new data in exit table.
This line does not work (the sum of values😞
- Mark as New
- Bookmark
- Subscribe
- Mute
- Subscribe to RSS Feed
- Permalink
- Notify Moderator
Connells 70 schrieb:
Werner Exinger wrote:
ad 1) whats the specific problem in adding additional data? Do you really mean rows or rather columns?
I mean that I want to add some new data in exit table.
This line does not work (the sum of values😞
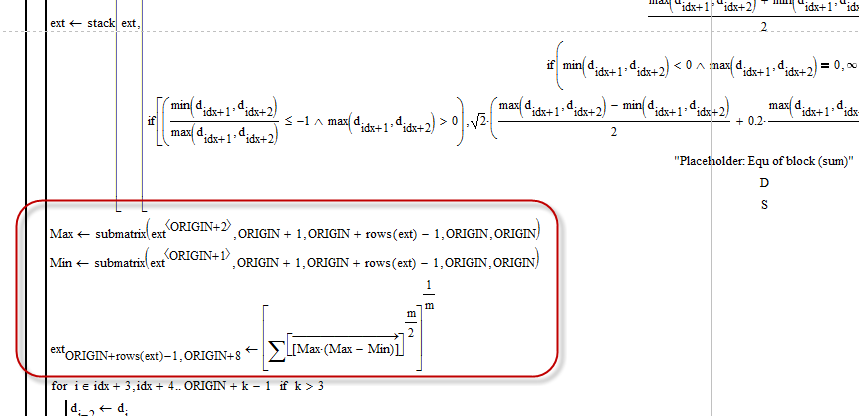
From what I see you are trying to add columns to the exit table, not rows.
The line you marked does not work, because you had chosen the vector sum and the argument is no vector.
As a quick hack I've implemented the first value in a similar way you did after the table.
Hope it helps!
- Mark as New
- Bookmark
- Subscribe
- Mute
- Subscribe to RSS Feed
- Permalink
- Notify Moderator
Thought it would be a good idea to introduce some local variables to make the code better manageable. I also got rid of some unnecessary conditions in your if''s (if hi is 0, lo IS neagtive; if lo/hi is negative, hi IS positiv).
Not sure if you are really calculating what you want with the two values "R" and especially "cycle". With "cycle" you may run into problems if "hi" is zero, You may want to use "on error".
