
Turn on suggestions
Auto-suggest helps you quickly narrow down your search results by suggesting possible matches as you type.
Showing results for
Please log in to access translation
Turn on suggestions
Auto-suggest helps you quickly narrow down your search results by suggesting possible matches as you type.
Showing results for
Community Tip - You can Bookmark boards, posts or articles that you'd like to access again easily! X
Translate the entire conversation x
Please log in to access translation
Options
- Subscribe to RSS Feed
- Mark Topic as New
- Mark Topic as Read
- Float this Topic for Current User
- Bookmark
- Subscribe
- Mute
- Printer Friendly Page
Divide by zero error when trying to create a graph
Mar 25, 2014
08:34 AM
- Mark as New
- Bookmark
- Subscribe
- Mute
- Subscribe to RSS Feed
- Permalink
- Notify Moderator
Please log in to access translation
Mar 25, 2014
08:34 AM
Divide by zero error when trying to create a graph
We are getting into integrals etc and have managed to create some neat shapes. However, trying to create a Gabriels horn using parametric equations results in an error message of "divide by zero". Yet, extracting the y and z values on their own does give values not equal to zero, but trying to plot them even on their own gives the same error.
What are we doing wrong. Can anyone help.
Labels:
- Labels:
-
Other
6 REPLIES 6
Mar 25, 2014
08:50 AM
- Mark as New
- Bookmark
- Subscribe
- Mute
- Subscribe to RSS Feed
- Permalink
- Notify Moderator
Please log in to access translation
Mar 25, 2014
08:50 AM
3D plots are always a problem, CreateMesh is usually the easiest way to generate the data for the plot.
Both forms will give the same plot, just enable/disable to see any difference
See attached .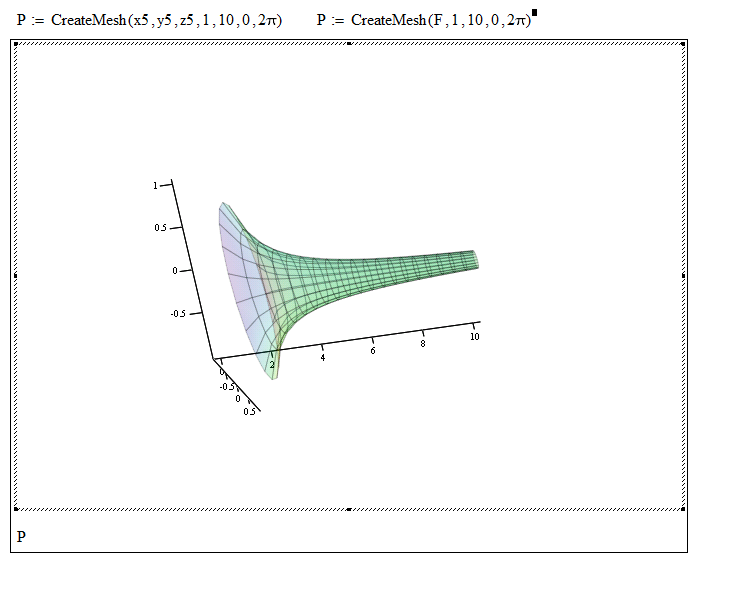
Regards
Andy
Mar 25, 2014
11:42 AM
- Mark as New
- Bookmark
- Subscribe
- Mute
- Subscribe to RSS Feed
- Permalink
- Notify Moderator
Please log in to access translation
Mar 25, 2014
11:42 AM
You can't plot z5 alone, you would have to use x5 and y5, too. You may do it as in the attached.
But here you would have to set the limits of the parameters in the 3D plot format menu, tab "Quickplot data" amd thats a bit cumbersome. So I think using Createmesh as Andy has shown is the better way and gives you more control.
Mar 26, 2014
03:37 AM
- Mark as New
- Bookmark
- Subscribe
- Mute
- Subscribe to RSS Feed
- Permalink
- Notify Moderator
Please log in to access translation
Mar 26, 2014
03:37 AM
Thanks guys. I tried the CreateMesh and I like it. Does have certain benefits and also allows an alternative method to produce answers. Appreciated.
Barend
Mar 26, 2014
03:41 AM
- Mark as New
- Bookmark
- Subscribe
- Mute
- Subscribe to RSS Feed
- Permalink
- Notify Moderator
Please log in to access translation
Mar 26, 2014
03:41 AM
If I change the function for y5 or z5 to r2 cos theta I can plot them individually. However, the moment I make it 1/r2 then if complains about division by zero although it still shows values, i.e. it still calcualtes both y5 and z5, but does not want to plot it.
Mar 26, 2014
04:49 AM
- Mark as New
- Bookmark
- Subscribe
- Mute
- Subscribe to RSS Feed
- Permalink
- Notify Moderator
Please log in to access translation
Mar 26, 2014
04:49 AM
That will be due to the quick-plot ranges that Mathcad applies for the graph.
If you look at the quickplot tab on the properties menu: Mathcad is plotting this over the range -5 to 5.
for r*cosTheta - no problem
but when you change to 1/r cos theta then there is a 1/0 issue at the mid point.
Changing the quick plot range will allow you to plot a graph but can be tricky to get a correct look.
Regards
Andy
Mar 26, 2014
06:09 AM
- Mark as New
- Bookmark
- Subscribe
- Mute
- Subscribe to RSS Feed
- Permalink
- Notify Moderator
Please log in to access translation
Mar 26, 2014
06:09 AM
Thanks


