Community Tip - You can Bookmark boards, posts or articles that you'd like to access again easily! X
- Subscribe to RSS Feed
- Mark Topic as New
- Mark Topic as Read
- Float this Topic for Current User
- Bookmark
- Subscribe
- Mute
- Printer Friendly Page
Evaluating Bessel functions ( e.g. Hankel functions of fisrt and second kind ) in MathCAD
- Mark as New
- Bookmark
- Subscribe
- Mute
- Subscribe to RSS Feed
- Permalink
- Notify Moderator
Evaluating Bessel functions ( e.g. Hankel functions of fisrt and second kind ) in MathCAD
Dear All,
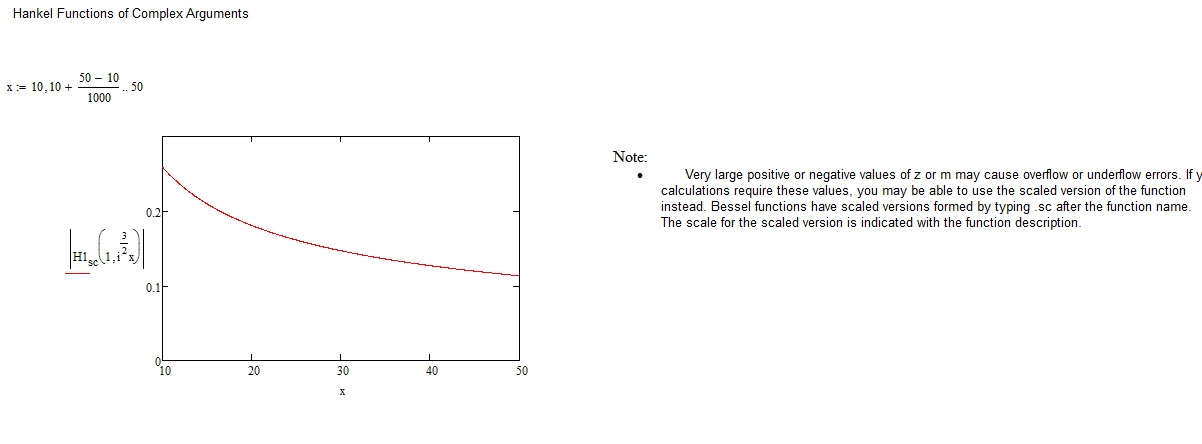
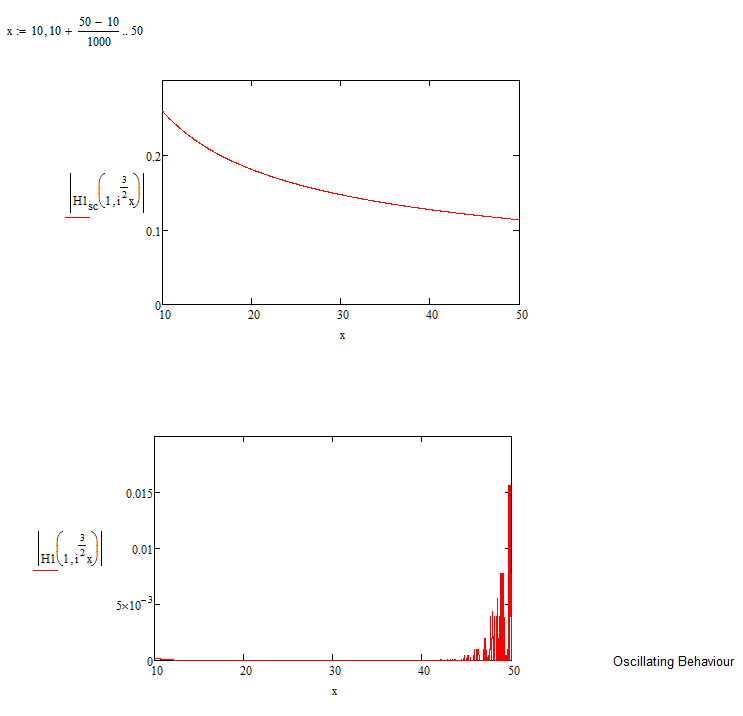
I have plotted the module of Hankel functions of complex arguments and I found an oscillating behaviour. What is the reason of this behaviour? how could be overcome?
Solved! Go to Solution.
- Labels:
-
Other
Accepted Solutions
- Mark as New
- Bookmark
- Subscribe
- Mute
- Subscribe to RSS Feed
- Permalink
- Notify Moderator
- Mark as New
- Bookmark
- Subscribe
- Mute
- Subscribe to RSS Feed
- Permalink
- Notify Moderator

- Mark as New
- Bookmark
- Subscribe
- Mute
- Subscribe to RSS Feed
- Permalink
- Notify Moderator
How effectively use the scaled functions in order to evaluate an hankel function? The scaled Hankel function must be re-converted to Hankel functions by using the appropriate scale?
- Mark as New
- Bookmark
- Subscribe
- Mute
- Subscribe to RSS Feed
- Permalink
- Notify Moderator
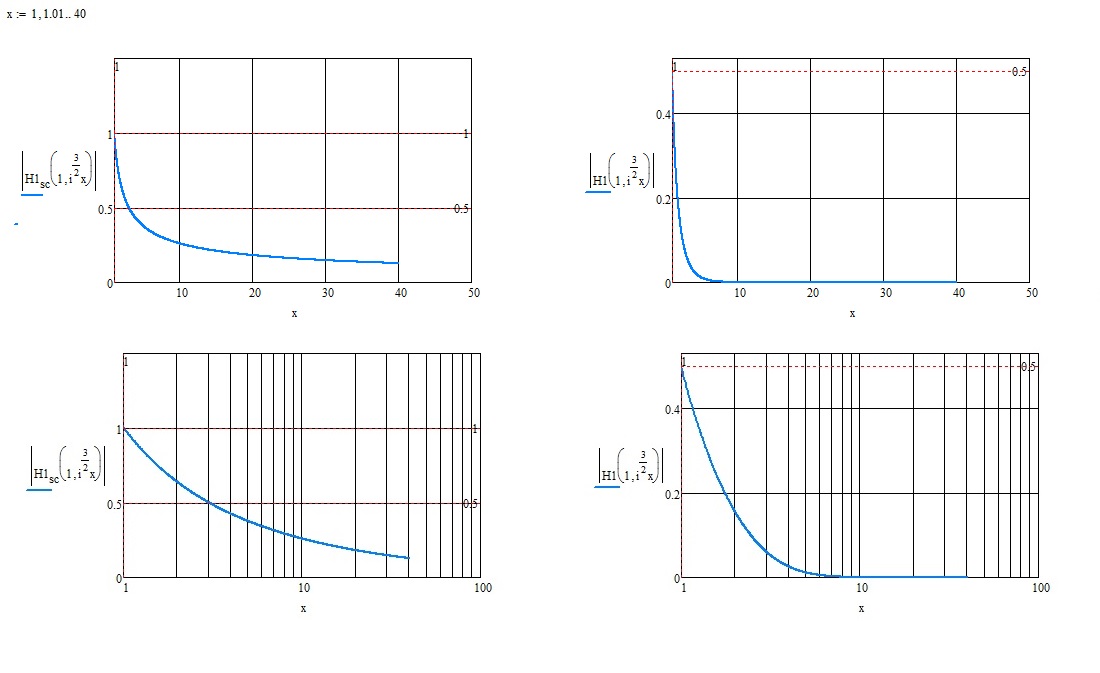
My previous answer was a bit rushed having found a solution to the problem. But I see that even without scaling the graph does not present oscillations.
- Mark as New
- Bookmark
- Subscribe
- Mute
- Subscribe to RSS Feed
- Permalink
- Notify Moderator
- Mark as New
- Bookmark
- Subscribe
- Mute
- Subscribe to RSS Feed
- Permalink
- Notify Moderator
For x <40, there are no oscillations. In my previous statement, I traced the function in that range.
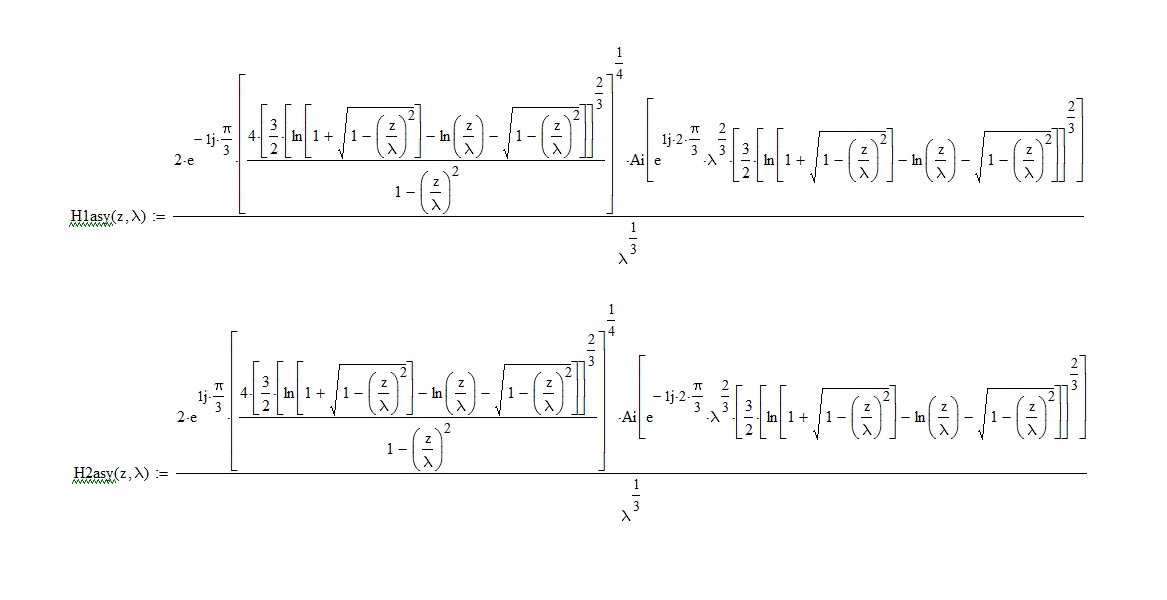
The asymptotic Hankel 1 and 2 expansions (index l) are:


