
Turn on suggestions
Auto-suggest helps you quickly narrow down your search results by suggesting possible matches as you type.
Showing results for
Please log in to access translation
Turn on suggestions
Auto-suggest helps you quickly narrow down your search results by suggesting possible matches as you type.
Showing results for
Community Tip - Did you get called away in the middle of writing a post? Don't worry you can find your unfinished post later in the Drafts section of your profile page. X
Translate the entire conversation x
Please log in to access translation
Options
- Subscribe to RSS Feed
- Mark Topic as New
- Mark Topic as Read
- Float this Topic for Current User
- Bookmark
- Subscribe
- Mute
- Printer Friendly Page
Exponential Fit Curve Help
Feb 28, 2013
07:26 PM
- Mark as New
- Bookmark
- Subscribe
- Mute
- Subscribe to RSS Feed
- Permalink
- Notify Moderator
Please log in to access translation
Feb 28, 2013
07:26 PM
Exponential Fit Curve Help
Hello,
I am trying to create a best-fit curve for a data set. I have imported two excelsheets containg the data into Mathcad. Each excel contains 1066 intergers. I have plotted them using the x-yplot functionality. The plot appears to follow an exponential projection. So, I tried to obtain exponential fit curve using the expfit() function. However, the fit function that I obtained is not correct, because it does not fit the data.
Please advise what I shoulddo to obtain the proper exponential fit curve.
Labels:
- Labels:
-
Statistics_Analysis
10 REPLIES 10
Feb 28, 2013
08:32 PM
- Mark as New
- Bookmark
- Subscribe
- Mute
- Subscribe to RSS Feed
- Permalink
- Notify Moderator
Please log in to access translation
Feb 28, 2013
08:32 PM
Please post a worksheet with the data. We can show you how to perform a generalized fit that can be applied to any function (but I don't know what that function might be without seeing the data).
Feb 28, 2013
08:41 PM
- Mark as New
- Bookmark
- Subscribe
- Mute
- Subscribe to RSS Feed
- Permalink
- Notify Moderator
Please log in to access translation
Feb 28, 2013
08:41 PM
Could you show me how to plot an expfit() function first . I am trying to plot it in MathCAD.
Feb 28, 2013
08:57 PM
- Mark as New
- Bookmark
- Subscribe
- Mute
- Subscribe to RSS Feed
- Permalink
- Notify Moderator
Please log in to access translation
Feb 28, 2013
08:57 PM
OK, but I can't plot an expfit function if I don't have data to fit it to 
Mar 01, 2013
01:51 AM
- Mark as New
- Bookmark
- Subscribe
- Mute
- Subscribe to RSS Feed
- Permalink
- Notify Moderator
Please log in to access translation
Mar 01, 2013
01:51 AM
Please see in attachment (this worksheet is taken from "Mathcad Help").
Mar 01, 2013
12:51 AM
- Mark as New
- Bookmark
- Subscribe
- Mute
- Subscribe to RSS Feed
- Permalink
- Notify Moderator
Please log in to access translation
Mar 01, 2013
12:51 AM
Have you read the Mathcad Help files on using that function and curve fitting in general?
Mar 01, 2013
01:38 AM
- Mark as New
- Bookmark
- Subscribe
- Mute
- Subscribe to RSS Feed
- Permalink
- Notify Moderator
Please log in to access translation
Mar 01, 2013
01:43 AM
- Mark as New
- Bookmark
- Subscribe
- Mute
- Subscribe to RSS Feed
- Permalink
- Notify Moderator
Please log in to access translation
Mar 05, 2013
08:44 AM
- Mark as New
- Bookmark
- Subscribe
- Mute
- Subscribe to RSS Feed
- Permalink
- Notify Moderator
Please log in to access translation
Mar 05, 2013
08:44 AM
Hello Jan Kowalski,
Thanks for sending me your sample mathcad files. They have been very helpful.
Now, I am trying to come up with a correlation coefficient associated with the curve fits. I tried using the function corr(A,B), as explained in the Mathcad Help site. However, I am not sure if I am using this fucntion correctly. How do I link the corr function with the fit curve? Are the varibable A, B supposed to be the raw data, or should I use the data from the curve fit? Please explain.
Mar 05, 2013
09:36 AM
- Mark as New
- Bookmark
- Subscribe
- Mute
- Subscribe to RSS Feed
- Permalink
- Notify Moderator
Please log in to access translation
Mar 05, 2013
09:36 AM
It would be time you begin attaching worksheets, don't you think so, too?
Are the varibable A, B supposed to be the raw data, or should I use the data from the curve fit?
Both! As you want to compare the original data (Y) to the fit data you get by the derived function H, you have to throw both into the corr function. First you have to create an apprpriate vector of fit values.
In lack of a sheet from yours I have taken one of the sheet Jan has provided to demonstrate.
Mar 05, 2013
12:36 PM
- Mark as New
- Bookmark
- Subscribe
- Mute
- Subscribe to RSS Feed
- Permalink
- Notify Moderator
Please log in to access translation
Mar 05, 2013
12:36 PM
Please be aware however that the correlation is no measure of a good fit. You will get exactly the same correlation value if you multiply Y by any constant.
A measure of fit would be the sum of square of difference between Y and fitData
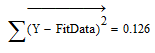
0 would mean a perfect fit (identity).
Better use the mean squared error as it takes in account the number of points. This would be the above divided by the number of points (length(Y))


