
Turn on suggestions
Auto-suggest helps you quickly narrow down your search results by suggesting possible matches as you type.
Showing results for
Please log in to access translation
Turn on suggestions
Auto-suggest helps you quickly narrow down your search results by suggesting possible matches as you type.
Showing results for
Community Tip - Did you know you can set a signature that will be added to all your posts? Set it here! X
Translate the entire conversation x
Please log in to access translation
Options
- Subscribe to RSS Feed
- Mark Topic as New
- Mark Topic as Read
- Float this Topic for Current User
- Bookmark
- Subscribe
- Mute
- Printer Friendly Page
Finding curve
Nov 20, 2015
08:53 AM
- Mark as New
- Bookmark
- Subscribe
- Mute
- Subscribe to RSS Feed
- Permalink
- Notify Moderator
Please log in to access translation
Nov 20, 2015
08:53 AM
Finding curve
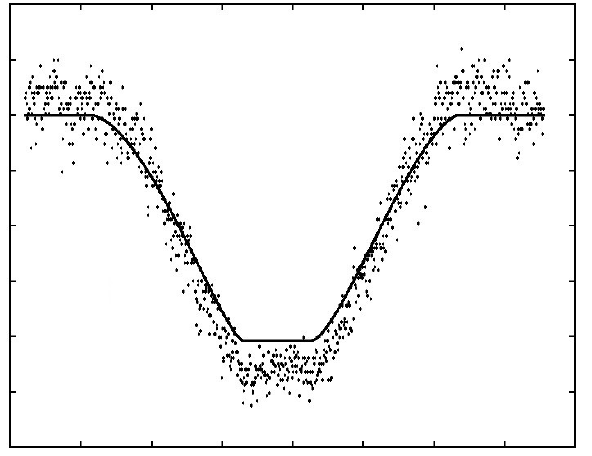
I want to approximate the experimental data by a curve as shown below on screenshot. I tried to use inverse probability density for the normal distribution, but without success. Are there any ideas in this regard (which equation can describe the data or maybe I need to create several sections/parts of the curve)?
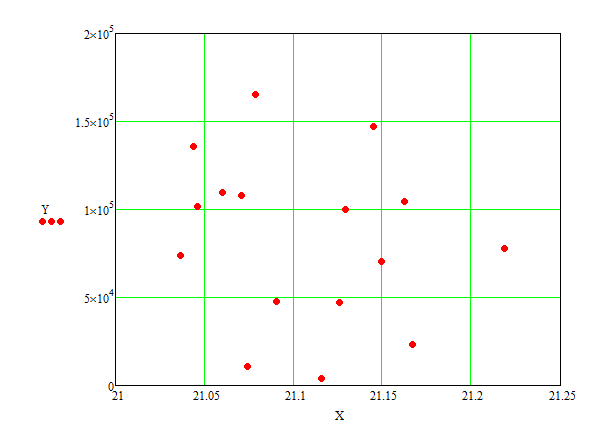
Initial data:

The approximating curve must have the following form:
Or this form:
Solved! Go to Solution.
Labels:
- Labels:
-
Statistics_Analysis
ACCEPTED SOLUTION
Accepted Solutions
Nov 21, 2015
06:20 PM
- Mark as New
- Bookmark
- Subscribe
- Mute
- Subscribe to RSS Feed
- Permalink
- Notify Moderator
Please log in to access translation
Nov 21, 2015
06:20 PM
Do you mean putting the Y data on a log10 scale?
10 REPLIES 10
Nov 20, 2015
09:55 AM
- Mark as New
- Bookmark
- Subscribe
- Mute
- Subscribe to RSS Feed
- Permalink
- Notify Moderator
Please log in to access translation
Nov 20, 2015
09:55 AM
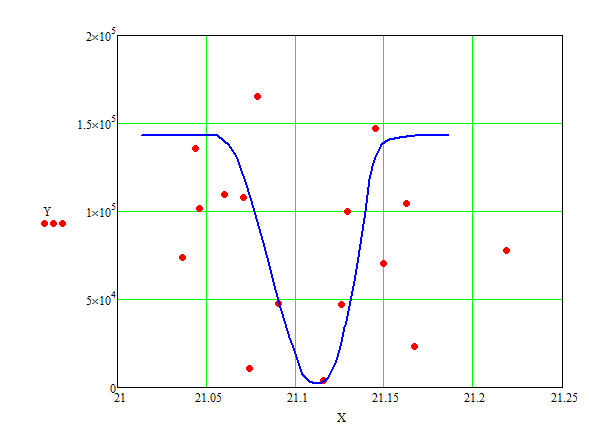
Here's one possibility. The data has so much error you are unlikely to get a curve that looks like what you want though. The fitted parameters will be pretty much meaningless too.
Nov 20, 2015
10:18 AM
- Mark as New
- Bookmark
- Subscribe
- Mute
- Subscribe to RSS Feed
- Permalink
- Notify Moderator
Please log in to access translation
Nov 20, 2015
10:18 AM
See please Figs 12.9, 12.12 & 12.13 here
Nov 21, 2015
05:22 PM
- Mark as New
- Bookmark
- Subscribe
- Mute
- Subscribe to RSS Feed
- Permalink
- Notify Moderator
Please log in to access translation
Nov 21, 2015
05:22 PM
Richard,
Thank you. Whether and there are any ideas how to correct your model on a case of transition to a decimal logarithm?
Nov 21, 2015
06:20 PM
- Mark as New
- Bookmark
- Subscribe
- Mute
- Subscribe to RSS Feed
- Permalink
- Notify Moderator
Please log in to access translation
Nov 21, 2015
06:35 PM
- Mark as New
- Bookmark
- Subscribe
- Mute
- Subscribe to RSS Feed
- Permalink
- Notify Moderator
Please log in to access translation
Nov 21, 2015
06:35 PM
Thanks!
Nov 22, 2015
07:23 AM
- Mark as New
- Bookmark
- Subscribe
- Mute
- Subscribe to RSS Feed
- Permalink
- Notify Moderator
Please log in to access translation
Nov 22, 2015
07:23 AM
Richard,
Could you please explain what technique you used to set the approximating function and selection of the coefficients/constants in the equation?
Nov 22, 2015
08:27 AM
- Mark as New
- Bookmark
- Subscribe
- Mute
- Subscribe to RSS Feed
- Permalink
- Notify Moderator
Please log in to access translation
Nov 22, 2015
08:27 AM
I'm not sure what you mean. You started with dnorm, which has two parameters. One controls the shift along the x-axis (D1) and one controls the width (D2). It seemed clear to me that two more were needed to make the curve pass through the data: one to scale the y-axis and one to offset on the y-axis. So I added D3 and D4.
With the logarithmic y-scale I forced D2 to a positive value (using |D2|) because genfit was trying to make it negative, causing the fit to fail.
I chose the guess values by temporarily changing F(x):=f(x,D) to F(x):=f(x,guess) and adjusting the guess values until the curve roughly passed through the data. Then I changed it back.
Does that answer your question?
Nov 23, 2015
08:44 AM
- Mark as New
- Bookmark
- Subscribe
- Mute
- Subscribe to RSS Feed
- Permalink
- Notify Moderator
Please log in to access translation
Nov 23, 2015
08:44 AM
Ok. I see.
Nov 20, 2015
10:46 AM
- Mark as New
- Bookmark
- Subscribe
- Mute
- Subscribe to RSS Feed
- Permalink
- Notify Moderator
Please log in to access translation
Nov 20, 2015
10:46 AM
Does the term "shotgun pattern" apply? 😉
Nov 21, 2015
06:45 PM
- Mark as New
- Bookmark
- Subscribe
- Mute
- Subscribe to RSS Feed
- Permalink
- Notify Moderator
Please log in to access translation
Nov 21, 2015
06:45 PM
Absolutely  .
.


