
Turn on suggestions
Auto-suggest helps you quickly narrow down your search results by suggesting possible matches as you type.
Showing results for
Please log in to access translation
Turn on suggestions
Auto-suggest helps you quickly narrow down your search results by suggesting possible matches as you type.
Showing results for
Community Tip - If community subscription notifications are filling up your inbox you can set up a daily digest and get all your notifications in a single email. X
Translate the entire conversation x
Please log in to access translation
Options
- Subscribe to RSS Feed
- Mark Topic as New
- Mark Topic as Read
- Float this Topic for Current User
- Bookmark
- Subscribe
- Mute
- Printer Friendly Page
Fitting a plane to 3 points
May 16, 2014
09:56 AM
- Mark as New
- Bookmark
- Subscribe
- Mute
- Subscribe to RSS Feed
- Permalink
- Notify Moderator
Please log in to access translation
May 16, 2014
09:56 AM
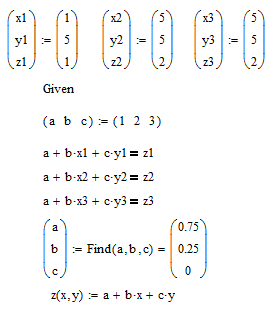
Fitting a plane to 3 points
Can anyone help with this worksheet please. I've setup 3 simultaneous equations but am struggling to solve them.
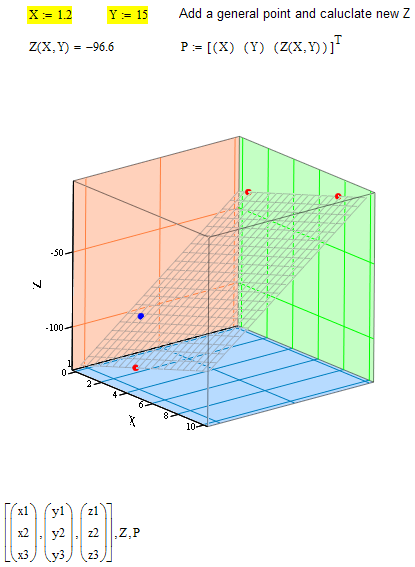
How to draw the points in 3D and the plane also??
Thanks
Jason
Solved! Go to Solution.
ACCEPTED SOLUTION
Accepted Solutions
May 16, 2014
12:11 PM
- Mark as New
- Bookmark
- Subscribe
- Mute
- Subscribe to RSS Feed
- Permalink
- Notify Moderator
Please log in to access translation
13 REPLIES 13
May 16, 2014
11:42 AM
- Mark as New
- Bookmark
- Subscribe
- Mute
- Subscribe to RSS Feed
- Permalink
- Notify Moderator
Please log in to access translation
May 16, 2014
11:42 AM
May by so:
May 16, 2014
11:44 AM
- Mark as New
- Bookmark
- Subscribe
- Mute
- Subscribe to RSS Feed
- Permalink
- Notify Moderator
Please log in to access translation
May 16, 2014
11:44 AM
Hi,, thanks. What happened to "d". And how would I then plot this plane as well as the 3 points on it?
Thanks
Jason
May 16, 2014
11:53 AM
- Mark as New
- Bookmark
- Subscribe
- Mute
- Subscribe to RSS Feed
- Permalink
- Notify Moderator
Please log in to access translation
May 16, 2014
11:53 AM
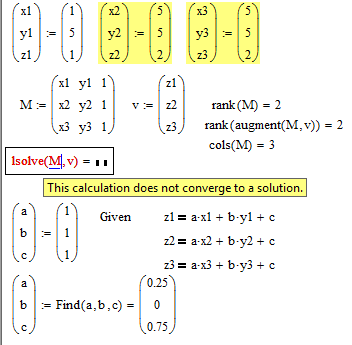
Two of the points are identical (nbrs 2 and 3) so there are an infinite number of planes that could go through them!
You get rid of d by dividing through by your original coefficient of z.
Alan
May 16, 2014
11:55 AM
- Mark as New
- Bookmark
- Subscribe
- Mute
- Subscribe to RSS Feed
- Permalink
- Notify Moderator
Please log in to access translation
May 16, 2014
11:55 AM
ahh. sorry thats a typo. point 3 shoud be (x,y,z = 1,1,3), its not real data its just to eb able to setup a matlab sheet to then deal with real data.
May 16, 2014
12:11 PM
- Mark as New
- Bookmark
- Subscribe
- Mute
- Subscribe to RSS Feed
- Permalink
- Notify Moderator
Please log in to access translation
May 19, 2014
04:22 AM
- Mark as New
- Bookmark
- Subscribe
- Mute
- Subscribe to RSS Feed
- Permalink
- Notify Moderator
Please log in to access translation
May 19, 2014
04:22 AM
Thankyou Alan.
May 19, 2014
06:39 AM
- Mark as New
- Bookmark
- Subscribe
- Mute
- Subscribe to RSS Feed
- Permalink
- Notify Moderator
Please log in to access translation
May 19, 2014
06:39 AM
I thought I had this worked out. For some reason, when I change the 3 data points (to real data), the plane doesn't cover the points but seems to start at the origin. It seems the "QuickPlot Data" is turned on. i can't see how to bypass this automatically.
also, when I want to add a genral point using the plane to calculate the Z for a given X,Y, I don't quite seem to be able to draw that point. its drawing 3 points for some reason.
Thanks
Jason
May 19, 2014
07:25 AM
- Mark as New
- Bookmark
- Subscribe
- Mute
- Subscribe to RSS Feed
- Permalink
- Notify Moderator
Please log in to access translation
May 19, 2014
07:25 AM
Jason Bryant wrote:
I thought I had this worked out. For some reason, when I change the 3 data points (to real data), the plane doesn't cover the points but seems to start at the origin. It seems the "QuickPlot Data" is turned on. i can't see how to bypass this automatically.
bypass? Telling from the sheet you attached it seems you found out yourself how to fix this problem by simply setting the range for x and y in the Quickplot tab. Its annoying that we cannot use variables there. You may consider using CreateMesh() to automate it. Calculate the minimum and maximum values for x and y depending on the coordinates of all points used and feed those values as limits in Createmesh() to create a data structure which will plot your plane.
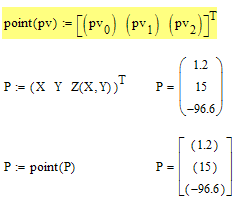
also, when I want to add a genral point using the plane to calculate the Z for a given X,Y, I don't quite seem to be able to draw that point. its drawing 3 points for some reason.
If you look at the sheet I posted earlier you find the solution. The elements of the vector representing the point must be 1x1 matrices, not scalars.
May 19, 2014
08:43 AM
- Mark as New
- Bookmark
- Subscribe
- Mute
- Subscribe to RSS Feed
- Permalink
- Notify Moderator
Please log in to access translation
May 19, 2014
08:43 AM
Perfect, thankyou. Why is it you can't just plot a point using scalars?
May 19, 2014
09:37 AM
- Mark as New
- Bookmark
- Subscribe
- Mute
- Subscribe to RSS Feed
- Permalink
- Notify Moderator
Please log in to access translation
May 19, 2014
09:37 AM
Why is it you can't just plot a point using scalars?
Because its implemented that way 😉
There is a logic here. To plot a couple of points you have to provide a 3-element vector consisting of three vectors representing the the x-, y- and z-coordinates of those points. To plot a single those vectors consist of just 1 element each. So Mathcad's 3D plot needs three vectors packed into one single outer vector to plot points. If you provide less than three vectors, Mathcad adds the missing ones itself. You provided just one vector and Mathcad would automatically interprete this as the z-coordinates of points - so you got three points instead of the one you expected. The x-coordinates are added as (0,1,2) and the y-coordinates as all zero, So you saw the points (0/0/X), (1/0/Y) and (2/0/Z).
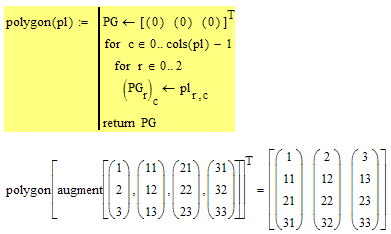
While there is a logic in that behaviour its nonetheless cumbersome and if you need it more than once you might consider creating a small function to do the conversion:
or for a list of points
May 17, 2014
02:26 AM
- Mark as New
- Bookmark
- Subscribe
- Mute
- Subscribe to RSS Feed
- Permalink
- Notify Moderator
Please log in to access translation
May 17, 2014
02:26 AM
AlanStevens wrote:
Two of the points are identical (nbrs 2 and 3) so there are an infinite number of planes that could go through them!
Yes. here better use not Find but lsolve function:
May 16, 2014
12:38 PM
- Mark as New
- Bookmark
- Subscribe
- Mute
- Subscribe to RSS Feed
- Permalink
- Notify Moderator
Please log in to access translation
May 16, 2014
12:38 PM
I guess the attached file should help.

May 19, 2014
04:22 AM
- Mark as New
- Bookmark
- Subscribe
- Mute
- Subscribe to RSS Feed
- Permalink
- Notify Moderator
Please log in to access translation
May 19, 2014
04:22 AM
Thankyou. I love your graphic!


