Community Tip - Did you know you can set a signature that will be added to all your posts? Set it here! X
- Subscribe to RSS Feed
- Mark Topic as New
- Mark Topic as Read
- Float this Topic for Current User
- Bookmark
- Subscribe
- Mute
- Printer Friendly Page
Fourier Amplitude Spectrum
- Mark as New
- Bookmark
- Subscribe
- Mute
- Subscribe to RSS Feed
- Permalink
- Notify Moderator
Fourier Amplitude Spectrum
Hello all,
I need help please with fourier analysis and the following problem:
- I can create my periodical time-signal f(t). --> Please see 1) and 2) in the attached file
- I also found the mathcad example from help menu for fourier analysis for calculating the fourier coefficients and plotting the graph. --> Please see 3a) in the attached file
- 1) For the following step I need a spectral analysis, means I need the amplitude spectrum and ideally a plot like this :
- 2) Afterwards I want to multiply the amplitude spectrum with an given impedance Z(s) to obtain the output voltage ripple
I hope you can help,
thanks in advance
- Mark as New
- Bookmark
- Subscribe
- Mute
- Subscribe to RSS Feed
- Permalink
- Notify Moderator
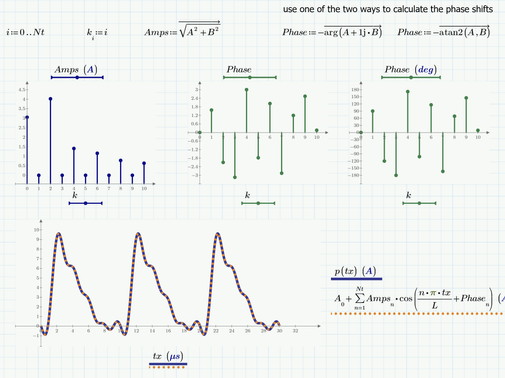
This should help in plotting the spectra
Note that the vectorization I applied in the calculations of the amplitudes and phases is not mandatory in this case but good habit, as we are dealing with vectors and want the calcs being done element-wise.
EDIT: Forgot a minus sign in first place - is fixed now
Prime 6 sheet attached
- Mark as New
- Bookmark
- Subscribe
- Mute
- Subscribe to RSS Feed
- Permalink
- Notify Moderator
You have the Fourier representation of your signal as a summation of sin and cos terms in Abschnitt 3). The arguments to the sin and cos can be rewritten as n*pi*t/L = 2*pi*f*t where f is the frequency you are looking for. This means that your f values are:
for all values of n in your range (1 to Nt). The magnitudes Mn are calculated from the corresponding values of A and B:
Success!
Luc
- Mark as New
- Bookmark
- Subscribe
- Mute
- Subscribe to RSS Feed
- Permalink
- Notify Moderator
- Mark as New
- Bookmark
- Subscribe
- Mute
- Subscribe to RSS Feed
- Permalink
- Notify Moderator
- Mark as New
- Bookmark
- Subscribe
- Mute
- Subscribe to RSS Feed
- Permalink
- Notify Moderator
Can you please also attach a .pdf file? I have mathcad prime 3.0 and cannot open or convert your sheets 😞
- Mark as New
- Bookmark
- Subscribe
- Mute
- Subscribe to RSS Feed
- Permalink
- Notify Moderator
You should be able to open the attached.
Success!
Luc
- Mark as New
- Bookmark
- Subscribe
- Mute
- Subscribe to RSS Feed
- Permalink
- Notify Moderator
Unfortunately no, I cant open it... 😞 It´s not compatible and also I cannot convert it. Hmmm ?!
Anyway, here is the result from the support from Luc and Werner so far:
How do I obtain the same discrete plot like Werner and ttokoro?
- Mark as New
- Bookmark
- Subscribe
- Mute
- Subscribe to RSS Feed
- Permalink
- Notify Moderator
It wasn't sure to which posting you were replying to. The use of the new and IMHO obsolete "Reply to topic" option at the end of each thread creates a reply to the very first, initial post of yourself.
Actually a pdf of my sheet would not show anything more than what can be seen in the picture I posted. There was nothing omitted and as I can see you were able to duplicate it.
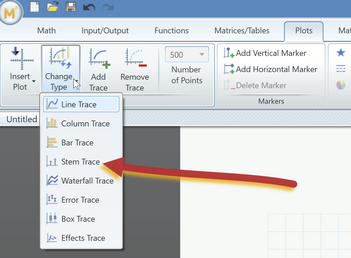
The get the stem plot shown by me and ttokoro you have to use the "Change Type" Button from the menu and chose "Stem Trace"
Mit deutschem Menü: Diagramme - Typ ändern - Stammdiagramm
You should also know that you can change the first (lowest), second and last scale value for each axis. This is often necessary as the automatic scaling produces undesired steps and scale values. Because of the tiny font you may have a hard time selecting those values, though.
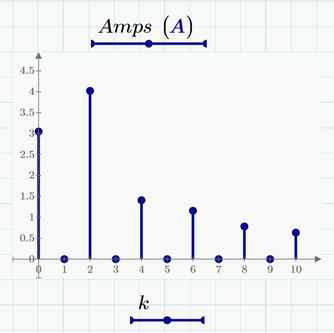
You can also move the axis around and for some reason in my amplitude plot the axis did not cross at 0;0. It should rather have looked like this:
- Mark as New
- Bookmark
- Subscribe
- Mute
- Subscribe to RSS Feed
- Permalink
- Notify Moderator
I still can't read Prime 7 files but I opened ttokoros file converted by Luc with Prime 6 and created a pdf. It may contain some formatting glitches but I guess the vital information should be all there. ttokoro did not made use of the Fourier series but rather used the built-in discrete Fourier transform (dft) and its inverse (idft).
- Mark as New
- Bookmark
- Subscribe
- Mute
- Subscribe to RSS Feed
- Permalink
- Notify Moderator
"Unfortunately no, I cant open it... "
That's weird. I can open the Files that I attached in my reply with Prime 2, then they should open in Prime 3 without problem.
You've probably selected the wrong file to open: the original file from Werner.
Please download the files that I attached (if necessary overwriting the files with the same name). Then open them with your Prime 3.
" I cannot convert it. "
Indeed, you cannot because you haven't installed Prime 7. But even then to convert them is a tedious task.
Success!
Luc
- Mark as New
- Bookmark
- Subscribe
- Mute
- Subscribe to RSS Feed
- Permalink
- Notify Moderator
Using FFT and IFFT, it requires 2^n data points to calculate.
- Mark as New
- Bookmark
- Subscribe
- Mute
- Subscribe to RSS Feed
- Permalink
- Notify Moderator
Great, thank you ttokoro,
thank you for the advice with the FFT and IFFT command. I will investigate further!
Best regards
- Mark as New
- Bookmark
- Subscribe
- Mute
- Subscribe to RSS Feed
- Permalink
- Notify Moderator
Okay, I have worked a little bit further on this topic and it should be almost completly finished now.
Thanks for the help guys!
So far so good, The amplitude spectrum looks now like this:
Next step, my output impedance as an example:
Next step, output voltage:
Next step: Obtaining Output voltage without DC part. Should be fine:
Last part what is needed:
Can you help to inverse transform the Voutpp amplitude spectrum to time domain?
I would like to plot the voltage (vout vs time) without the DC part
Best regards!
- Mark as New
- Bookmark
- Subscribe
- Mute
- Subscribe to RSS Feed
- Permalink
- Notify Moderator
What is the objective:
1. To get the resulting output voltage.
(Which would be:

or
2. To learn Fourier transforms
You should be more careful about the impedance. If it is given as:
You cannot simply change the parameter s to f:
Because s is a complex number. Taking the absolute value of the result becomes ridiculous, because now all your numbers are real:
With, a Z(s) defined as:
You get:
That's quite different from your result. This is important since you are going to use that impedance in further calculations.
Now to the inverse Fourier. You have the amplitudes of the (co)sine waves at each of the frequencies fk[i. All that should remain is adding those (co)sines. I'd guess something like:
Then you should be able to plot:
versus tx.
But first correctly use your impedance.
Success!
Luc
- Mark as New
- Bookmark
- Subscribe
- Mute
- Subscribe to RSS Feed
- Permalink
- Notify Moderator
If the output is voltage, high frequency short the capacitor and Ztotal becomes 50 mΩ. That is V=IZ=I/20 as shown in my results.
- Mark as New
- Bookmark
- Subscribe
- Mute
- Subscribe to RSS Feed
- Permalink
- Notify Moderator
If the current has the period 
- Mark as New
- Bookmark
- Subscribe
- Mute
- Subscribe to RSS Feed
- Permalink
- Notify Moderator
Hi,
you might be interested in this work of mine made years ago on the subject:
The first seventy pages show the algorithms used and the signals with graphs, the spectra of which will be produced from page 72 onwards.
The original files for M15 were published some time ago in the community, just search and download them.
- Mark as New
- Bookmark
- Subscribe
- Mute
- Subscribe to RSS Feed
- Permalink
- Notify Moderator
Can you attach a Mathcad file with this?
It would be good to post somewhere all these things that you have done in the past, both pdf and Mathcad files. Maybe some will help.
- Mark as New
- Bookmark
- Subscribe
- Mute
- Subscribe to RSS Feed
- Permalink
- Notify Moderator
The original files for M15 I published some time ago in the community, just search (Fourier Analysis) and download them.
- Mark as New
- Bookmark
- Subscribe
- Mute
- Subscribe to RSS Feed
- Permalink
- Notify Moderator
You might also be interested in this other work of mine from years ago:


