
Turn on suggestions
Auto-suggest helps you quickly narrow down your search results by suggesting possible matches as you type.
Showing results for
Please log in to access translation
Turn on suggestions
Auto-suggest helps you quickly narrow down your search results by suggesting possible matches as you type.
Showing results for
Community Tip - You can Bookmark boards, posts or articles that you'd like to access again easily! X
Translate the entire conversation x
Please log in to access translation
Options
- Subscribe to RSS Feed
- Mark Topic as New
- Mark Topic as Read
- Float this Topic for Current User
- Bookmark
- Subscribe
- Mute
- Printer Friendly Page
Freq. Resp. Assurance Criteria (FRAC)
Mar 30, 2016
10:46 AM
- Mark as New
- Bookmark
- Subscribe
- Mute
- Subscribe to RSS Feed
- Permalink
- Notify Moderator
Please log in to access translation
Mar 30, 2016
10:46 AM
Freq. Resp. Assurance Criteria (FRAC)
to all
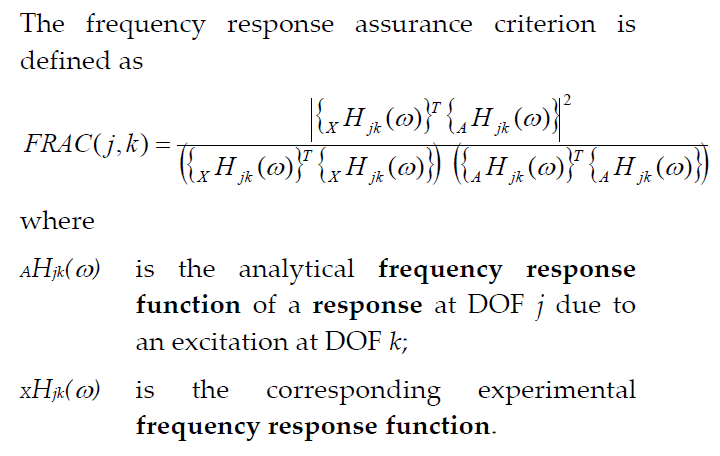
I am playing around with what is known as 'Frequency Response Assurance Criteria' (FRAC). I have attached an example with some ref
I understand that the Freq. Response Function (FRF), noted H(w) is a complex function containing magnitude and phase information
- If one has got magnitude and phase info (at each frequency) (from a physical test) does one need to create a complex equivalent of the data to apply the criteria (A*exp(iw+phase)) ?
- In the case of the analytical data (FRF) I am not sure I can get the phase (but will need to check) as it is from a random analysis
- I found an example of a FRAC equation involving sum, see attached, assuming it is correct (not sure it is!), how does one "code" the sum? I did it but it look wrong. I interpreted the equation as calculating a FRAC value in a range w1 to w2. I f guess if one plots it one can see the "evolution" of the FRAC
The example attached contains dummy vectors. I'll need to see if I can put my hand on "real" data
Thanks
Regards
Labels:
- Labels:
-
Statistics_Analysis
21 REPLIES 21
Mar 30, 2016
11:27 AM
- Mark as New
- Bookmark
- Subscribe
- Mute
- Subscribe to RSS Feed
- Permalink
- Notify Moderator
Please log in to access translation
Mar 30, 2016
11:27 AM
The CFFT function in Mathcad creates a vector of complex values that could be used for your test.
A place to start:
Mar 30, 2016
11:54 AM
- Mark as New
- Bookmark
- Subscribe
- Mute
- Subscribe to RSS Feed
- Permalink
- Notify Moderator
Please log in to access translation
Mar 30, 2016
11:54 AM
1) Yes, you will have to convert the magnitude and phase to a vector of complex numbers.
2) The equation doesn't look right to me either. I can't figure out any way to get it to give the same number as your other function. Note however that in the numerator you have the square in the wrong place: it is the square of the sum, not the sum of the squares.
Mar 30, 2016
12:30 PM
- Mark as New
- Bookmark
- Subscribe
- Mute
- Subscribe to RSS Feed
- Permalink
- Notify Moderator
Please log in to access translation
Mar 30, 2016
12:30 PM
Thanks for the input/helps. Much appreciated
found another version of the paper and as suspected the eq. was not correct. See attached for updated file
Fred
Really stupid question (but I don't ask i'll never know): Why doe one need the CFFT function tp create the complex vector?
If I have a vector or magnitude and a vector of phase (for each frequency) is not possible to "combine" both to create the complex vector?
Mar 30, 2016
01:32 PM
- Mark as New
- Bookmark
- Subscribe
- Mute
- Subscribe to RSS Feed
- Permalink
- Notify Moderator
Please log in to access translation
Mar 30, 2016
01:32 PM
J B,
The FFT functions in Mathcad (there are at least 4 of them) all take a vector of sampled values (assumed acquired at fixed sampling frequency) and move directly to a complex number value that describes the amplitude and phase at that frequency. (Amplitude is simply the magnitude, phase is recovered with the function "arg" (I believe.) There are subtle differences in how each of the functions provides their answer, how the amplitudes are normalized, some by how many samples they need to have (lower case FFT requires number of samples be a power of 2, I think.) Details can be found in help and examples are many.
So, if you're end goal is the complex vector and you have a time history these are a direct path. Now if you have amplitude and phase, then you need to construct the vector; and how you would do that becomes another discussion.
Note that the FFT functions return a vector the same length as your time history sample. And sample size determines your frequency resolution (along with sampling frequency.) So if you had a real "experimental" distribution, in my experience what you have is a digitally sampled time history file. My example had three frequencies, amplitudes, phases, and "experimental deviations." (Because I was lazy.) Assume for a minute that we have A(t) as the analytical description, the way we think the system responds. By measurement (shaker and accelerometer) we acquire eSt, the experimental time history of the response function. That file is 5000 samples long, the FFT (eHf) will be 5000 frequencies long. How will you create a 5000 frequency complex vector from three? Or, conversely, how will you strip eSt down to three frequencies?
Mar 31, 2016
09:49 AM
- Mark as New
- Bookmark
- Subscribe
- Mute
- Subscribe to RSS Feed
- Permalink
- Notify Moderator
Please log in to access translation
Mar 31, 2016
09:49 AM
Thanks for the explanation and example. Will need a bit of time to digest the example
In my case the signal is not in the time domain but in the frequency domain. It's in the form of a Power Spectrum Density (PSD)
Both magnitude and phase are available (I suspect phase in in relation to the excitation point) so why one cannot use the polar format (mag*exp(iphase)) to create an equivalent complex, see attached. I created a dummy set of data to play with
Nov 30, 2018
12:41 PM
- Mark as New
- Bookmark
- Subscribe
- Mute
- Subscribe to RSS Feed
- Permalink
- Notify Moderator
Please log in to access translation
Nov 30, 2018
12:41 PM
I am back at looking at the equation of the Freq. Resp. Assurance Criteria (FRAC) and would like to know if someone could advise me on what I am doing wrong
I have 2 vectors (realdata & predicteddata) containing complex data. see attached mcad15 sheet
I am trying to calculate the (cumulated!) FRAC bu I think I am getting garbage ! I would expect the cumulated frac plot to stay close to 1 up to 500Hz but it drops close to zero to zero. Might be a "scale" issue for one of the vector
any hints, help, advise would be welcome
Thanks
Regards
Nov 30, 2018
10:23 PM
- Mark as New
- Bookmark
- Subscribe
- Mute
- Subscribe to RSS Feed
- Permalink
- Notify Moderator
Please log in to access translation
Nov 30, 2018
10:23 PM
Can you post this as a PDF file please
Dec 01, 2018
03:46 AM
- Mark as New
- Bookmark
- Subscribe
- Mute
- Subscribe to RSS Feed
- Permalink
- Notify Moderator
Please log in to access translation
Dec 01, 2018
03:46 AM
Hi Fred!
Here is the pdf you requested and also the file converted to Prime 5. The latter fails as Prime still does not support the convenient "insert-data-table".
Dec 01, 2018
08:31 AM
- Mark as New
- Bookmark
- Subscribe
- Mute
- Subscribe to RSS Feed
- Permalink
- Notify Moderator
Please log in to access translation
Dec 01, 2018
08:31 AM
Thanks Werner!
A short search found the following definition:

Reviewing your two responses:

reveals a divergence at the lowest frequency. (Further divergence, "close to zero at zero," is due to there being no data below 10.) So the FRAC looks like you expected (mostly!) Take the win!

Dec 01, 2018
03:15 PM
- Mark as New
- Bookmark
- Subscribe
- Mute
- Subscribe to RSS Feed
- Permalink
- Notify Moderator
Please log in to access translation
Dec 01, 2018
03:15 PM
Thanks for the hint Fred. Yes that's the equation I am using
I can start the FRAC calc at say f =100 and it makes no difference. I think it because I had a "picture" in my head. I expected the FRAC curve to start going up (back to 1) near the 1st main peak as real vs. prediction is not bad. In reality it's stay at 1 until the difference (between the 2 vectors) kicks in. I plotted the FRAC, see attached, on top of the real & prediction data and I think it makes more sense. Happy to be corrected on this one.
the FRAC approach is still telling me that the prediction (vector) is a poor match to the real (vector). A visual inspection concludes that it's not that bad (actually quite good !!).
Dec 02, 2018
10:53 AM
- Mark as New
- Bookmark
- Subscribe
- Mute
- Subscribe to RSS Feed
- Permalink
- Notify Moderator
Please log in to access translation
Dec 02, 2018
10:53 AM
@JBlackhole wrote:
the FRAC approach is still telling me that the prediction (vector) is a poor match to the real (vector). A visual inspection concludes that it's not that bad (actually quite good !!).
The frequency responses have two parts--magnitude and phase. Your FRAC (I believe) looks at both. While your magnitude graph shows good agreement past the first resonance, you haven't looked at the phase correlation. I suspect that's why your FRAC drops so far so fast. Plot the phases of the two frequency responses.
BTW, a helicopter dynamacist comparing measured vs predicted response curves like this would be thrilled at the correlation! The more usual observation was, "Well, they're almost the same shape." ![]()
Dec 03, 2018
02:58 AM
- Mark as New
- Bookmark
- Subscribe
- Mute
- Subscribe to RSS Feed
- Permalink
- Notify Moderator
Please log in to access translation
Dec 03, 2018
02:58 AM
Fred
I might be one of those helicopter dynamacist ! and I was initially thrilled at the correlation as they're almost the same shape.
I am applying the FRAC formula as found/described in the literature. As it is applicable to FRFs, the vectors are complex (real &imaginary). I do have a plot of the phase. Will play around with the magnitude only
Dec 03, 2018
08:36 AM
- Mark as New
- Bookmark
- Subscribe
- Mute
- Subscribe to RSS Feed
- Permalink
- Notify Moderator
Please log in to access translation
Dec 03, 2018
08:36 AM
Might want to build yourself a couple of simple examples. Mathcad can take a time function, sample it to a vector and take an FFT of that sampled vector. By controlling what goes in you can "calibrate" what comes out.
Dec 07, 2018
03:37 PM
- Mark as New
- Bookmark
- Subscribe
- Mute
- Subscribe to RSS Feed
- Permalink
- Notify Moderator
Please log in to access translation
Dec 07, 2018
03:37 PM
well just did a test with made of curves and it seems to work. Only use a constant phase for each vector. I convert the magnitude/phase into a complex vector. But the phase does not seem to have an effect !
Dec 07, 2018
10:31 PM
- Mark as New
- Bookmark
- Subscribe
- Mute
- Subscribe to RSS Feed
- Permalink
- Notify Moderator
Please log in to access translation
Dec 07, 2018
10:31 PM
Tough to tell why the FRAC looks like it does when the signals are so different.
Attached is a Prime 4.0 sheet that sets up time traces, takes four second records and takes the FFT's of these traces. I have only express, so the FFT's don't work for me, but they should for you.
See how the FRACs look for them. You can adjust the amplitude and phase of the two predictions.
Dec 08, 2018
02:06 PM
- Mark as New
- Bookmark
- Subscribe
- Mute
- Subscribe to RSS Feed
- Permalink
- Notify Moderator
Please log in to access translation
Dec 08, 2018
02:06 PM
thanks for that but I am afraid I do not have prime or express - mcad15 only
Dec 08, 2018
02:31 PM
- Mark as New
- Bookmark
- Subscribe
- Mute
- Subscribe to RSS Feed
- Permalink
- Notify Moderator
Please log in to access translation
Dec 08, 2018
02:31 PM
Attached is an Smath created "saved as Mathcad" file that 15 should be able to open. (Smath will open version 15 files, but the conversion is a bit poorer than Prime's converter. Plots and solve blocks just disappear.)
See what falls out of this that you can use.
I like Mathcad's CFFT function for getting an FFT of a time history file. My attempts at a FRAC from FFT vectors have not yet been successful.
Dec 08, 2018
03:21 PM
- Mark as New
- Bookmark
- Subscribe
- Mute
- Subscribe to RSS Feed
- Permalink
- Notify Moderator
Please log in to access translation
Dec 08, 2018
03:21 PM
I found a paper with a different equation for FRAC. This one seems to track nicely. See second Smath/xmcd file.
Dec 09, 2018
10:46 AM
- Mark as New
- Bookmark
- Subscribe
- Mute
- Subscribe to RSS Feed
- Permalink
- Notify Moderator
Please log in to access translation
Dec 09, 2018
10:46 AM
Fred
I have that paper - one of the 1st one I used. A aerospace spec is giving the equation show on the attached
I managed to open file provided in smath - very slow to update
Dec 09, 2018
11:06 AM
- Mark as New
- Bookmark
- Subscribe
- Mute
- Subscribe to RSS Feed
- Permalink
- Notify Moderator
Please log in to access translation
Dec 09, 2018
11:06 AM
I've come to the (belated) conclusion (after looking at your image file,) that what I'm proposing isn't what you want. You're trying to compare theoretical and measured transfer functions, not spectrums. We would measure them by applying a shaker or a rap hammer with a force transducer, and one or more accelerometers, then dividing one signal by the other as the frequency swept (for the shaker.) This is not what I've been trying to do. Sorry I've wasted your time leading down a wrong path.
Dec 09, 2018
11:58 AM
- Mark as New
- Bookmark
- Subscribe
- Mute
- Subscribe to RSS Feed
- Permalink
- Notify Moderator
Please log in to access translation
Dec 09, 2018
11:58 AM
Fred
no time wasted at all. Always good to hear expert opinion and learn way of doings things. I killed the smath file as it was going nowhere!
You are spot on with the transfer function. the FRAC compare the transfer function (which are complex vector ie at each frequency the value is a complex vector.
For my test I do not divide by the shaker unit (it's a constant) but can do ultimately. if one divide by the input force then one get the inertance (accelerance for some people). I never get a input force, only the input (shaker) acceleration.


