
Turn on suggestions
Auto-suggest helps you quickly narrow down your search results by suggesting possible matches as you type.
Showing results for
Please log in to access translation
Turn on suggestions
Auto-suggest helps you quickly narrow down your search results by suggesting possible matches as you type.
Showing results for
Community Tip - Have a PTC product question you need answered fast? Chances are someone has asked it before. Learn about the community search. X
Translate the entire conversation x
Please log in to access translation
Options
- Subscribe to RSS Feed
- Mark Topic as New
- Mark Topic as Read
- Float this Topic for Current User
- Bookmark
- Subscribe
- Mute
- Printer Friendly Page
Generating many plots
Mar 13, 2017
05:31 PM
- Mark as New
- Bookmark
- Subscribe
- Mute
- Subscribe to RSS Feed
- Permalink
- Notify Moderator
Please log in to access translation
Mar 13, 2017
05:31 PM
Generating many plots
I would like to generate many plots using a range of different parameter values. I did 10 in the attached document manually using Quickplot. Is there a way to do this more efficiently especially if I would like to look at a larger number of plots? Thanks for any help.
6 REPLIES 6
Mar 13, 2017
05:52 PM
- Mark as New
- Bookmark
- Subscribe
- Mute
- Subscribe to RSS Feed
- Permalink
- Notify Moderator
Please log in to access translation
Mar 13, 2017
05:52 PM
Something like this is possible:
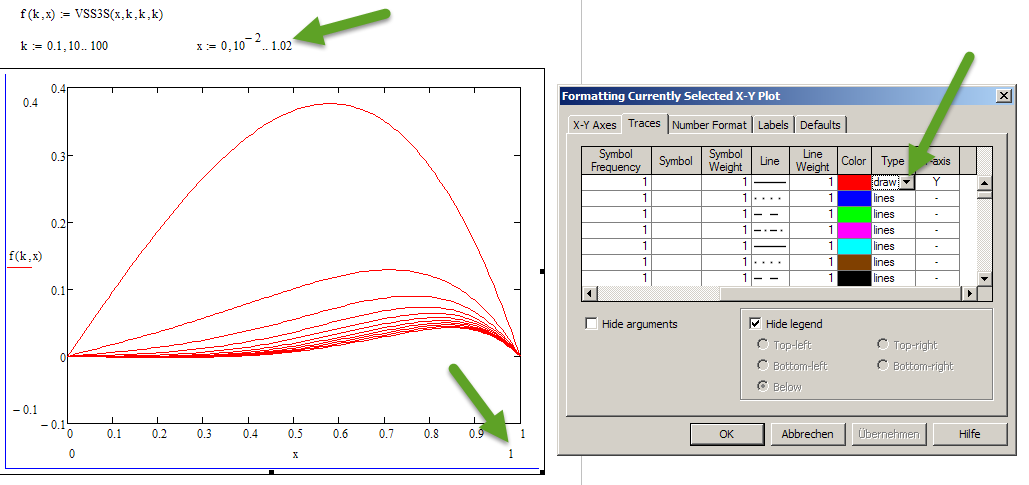
The variable parameter k has to be a range and must be the first function argument. Guess it won't work with more than one parameter.
x must be a range and to avoid lines connecting back the first and last point of the plots you have to set the type from "line" to "draw" and make the range variable for x a littlle bit larger (1.02( than the manually set plot limit (1).
Drawbacks are:
You can't use different colors or line styles - all plots share the same
k must be a range and so it must be a linear scale. It does not work with a vector of selected values or a vector created with logspace (which would be more appropriate in your case, I guess).
Mar 13, 2017
06:10 PM
- Mark as New
- Bookmark
- Subscribe
- Mute
- Subscribe to RSS Feed
- Permalink
- Notify Moderator
Please log in to access translation
Mar 13, 2017
06:10 PM
Thanks, as always. That was helpful and certainly more efficient than the way I was doing it. But my question was not clear. The document I posted has 10 different plots with 8 curves on each. Your answer addresses how to put multiple curves on each plot, but is there any way to generate the 10 plots except one by one. Ideally, I would like to generate more than 10. (Why do I want to do this you may ask -- because I am working with someone using Matlab. She generated 64 of these plots and I am trying to compare with her results. Probably the simpler solution is to monkey with her Matlab code, but I thought I would ask).
Mar 13, 2017
06:27 PM
- Mark as New
- Bookmark
- Subscribe
- Mute
- Subscribe to RSS Feed
- Permalink
- Notify Moderator
Please log in to access translation
Mar 13, 2017
06:27 PM
There is no way in Mathcad to 'automate' the generation of plots, like it may be in MatLab.
If you have a large number of plots to generate, and you want them to show similar content, best way is to create one, shape it until you are satisfied with how it looks, then copy it as many times as you need, then edit the input variables (expressions for x- and y traces) as needed for each of them.
Success!
Luc
Mar 13, 2017
06:31 PM
- Mark as New
- Bookmark
- Subscribe
- Mute
- Subscribe to RSS Feed
- Permalink
- Notify Moderator
Please log in to access translation
Mar 13, 2017
06:31 PM
Here is a small routine which overcomes some of the drawbacks.
The abscissa values X and the parameter values k can be ranges or vectors.
No need to use "draw" or to make the x range larger than necessary.
Still just one color and line style for all plots.

EDIT: I overlooked your answer where you clarified your needs. As Luc already said there is no automatic way to generate plots like in MatlLab.
Mar 14, 2017
05:11 AM
- Mark as New
- Bookmark
- Subscribe
- Mute
- Subscribe to RSS Feed
- Permalink
- Notify Moderator
Please log in to access translation
Mar 14, 2017
05:11 AM
You could do something like the attached, which makes it much easier to produce many plots as long as each plot has a similar structure and just varies by virtue of the varying values of k.
Alan
Mar 14, 2017
11:58 AM
- Mark as New
- Bookmark
- Subscribe
- Mute
- Subscribe to RSS Feed
- Permalink
- Notify Moderator
Please log in to access translation
Mar 14, 2017
11:58 AM
Thanks to all for the information and suggestions.


