Community Tip - Have a PTC product question you need answered fast? Chances are someone has asked it before. Learn about the community search. X
- Subscribe to RSS Feed
- Mark Topic as New
- Mark Topic as Read
- Float this Topic for Current User
- Bookmark
- Subscribe
- Mute
- Printer Friendly Page
Graphing not working Using Genfit Coefficients
- Mark as New
- Bookmark
- Subscribe
- Mute
- Subscribe to RSS Feed
- Permalink
- Notify Moderator
Graphing not working Using Genfit Coefficients
Hello there,
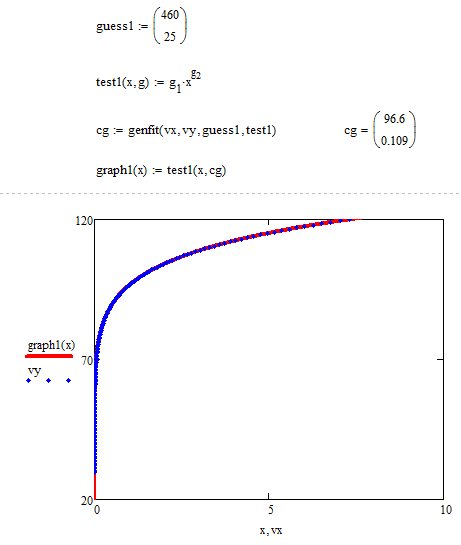
I am using genfit to come with the coefficients for a best fit equation for points I have created. However, when I try to plot the graph using the coefficients to see how accurate is the equation as compared to the points in the same mathcad sheet it won't plot. Can someone help me out. I have attached the mathcad sheet. Thanks.
Solved! Go to Solution.
- Labels:
-
Statistics_Analysis
Accepted Solutions
- Mark as New
- Bookmark
- Subscribe
- Mute
- Subscribe to RSS Feed
- Permalink
- Notify Moderator
- Mark as New
- Bookmark
- Subscribe
- Mute
- Subscribe to RSS Feed
- Permalink
- Notify Moderator
Hello, Ranjan,
Have you defined your variable (x) ?
Cordially.
Denis
- Mark as New
- Bookmark
- Subscribe
- Mute
- Subscribe to RSS Feed
- Permalink
- Notify Moderator
Tried defining the variable x but still no luck.
Ranjan
- Mark as New
- Bookmark
- Subscribe
- Mute
- Subscribe to RSS Feed
- Permalink
- Notify Moderator
You have defined ORIGIN=1 but you try to use 0 as the first element in the cg1 vector.
- Mark as New
- Bookmark
- Subscribe
- Mute
- Subscribe to RSS Feed
- Permalink
- Notify Moderator
I am not clear on this point. Can you please explain. Thanks.
Ranjan
- Mark as New
- Bookmark
- Subscribe
- Mute
- Subscribe to RSS Feed
- Permalink
- Notify Moderator
Have a look at the attached.
- Mark as New
- Bookmark
- Subscribe
- Mute
- Subscribe to RSS Feed
- Permalink
- Notify Moderator
Ranjan Nadarajah wrote:
I am not clear on this point. Can you please explain. Thanks.
You may (re)define ORIGIN globally to zero as Mike has done, but the most easiest way to make your sheet work is to simply delete the line below the definition of your variables which says ORIGIN:=1. You don't need it and you never make use of it in your sheet anyway. So get rid of it.
- Mark as New
- Bookmark
- Subscribe
- Mute
- Subscribe to RSS Feed
- Permalink
- Notify Moderator
Ranjan Nadarajah wrote:
I am not clear on this point. Can you please explain. Thanks.
Ranjan

- Mark as New
- Bookmark
- Subscribe
- Mute
- Subscribe to RSS Feed
- Permalink
- Notify Moderator
You got it spot on Harvey ![]()
- Mark as New
- Bookmark
- Subscribe
- Mute
- Subscribe to RSS Feed
- Permalink
- Notify Moderator
Wouldn't a simple power function make a much better fit?

- Mark as New
- Bookmark
- Subscribe
- Mute
- Subscribe to RSS Feed
- Permalink
- Notify Moderator
I cannot use a power law as I require the curve fit I am using to input the coefficients into a finite element analysis program.
Ranjan


