
Turn on suggestions
Auto-suggest helps you quickly narrow down your search results by suggesting possible matches as you type.
Showing results for
Please log in to access translation
Turn on suggestions
Auto-suggest helps you quickly narrow down your search results by suggesting possible matches as you type.
Showing results for
Community Tip - If community subscription notifications are filling up your inbox you can set up a daily digest and get all your notifications in a single email. X
Translate the entire conversation x
Please log in to access translation
Options
- Subscribe to RSS Feed
- Mark Topic as New
- Mark Topic as Read
- Float this Topic for Current User
- Bookmark
- Subscribe
- Mute
- Printer Friendly Page
Graphs in Mathcad prime 3.0
Oct 13, 2014
05:16 AM
- Mark as New
- Bookmark
- Subscribe
- Mute
- Subscribe to RSS Feed
- Permalink
- Notify Moderator
Please log in to access translation
Oct 13, 2014
05:16 AM
Graphs in Mathcad prime 3.0
Hi all,
Thanks is advance.
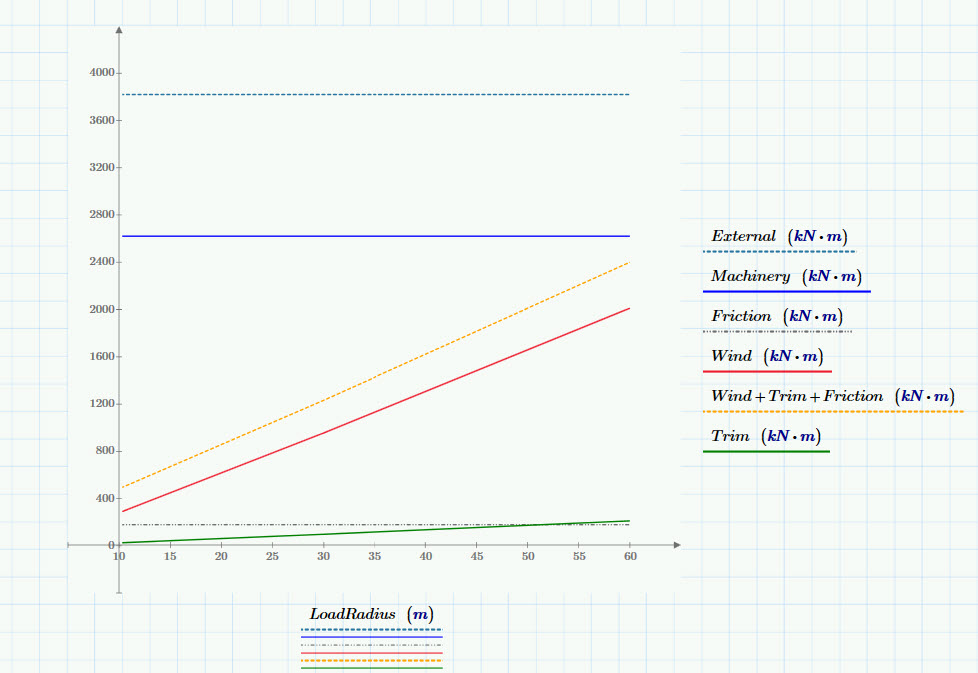
I am making a graph for moments vs load radius..My Load radius start at 10.3m and hence the graph lines also start at that point (the vertical line in the document). But I want those lines to start from zero ( I mean y axis). How can I do so?
I am making these plots against LoadRadius, Rw which has three values in a matirx but my other variables just has one constant value. So how can I put these constant value against three load radius, which will utimately produce a straight horizontal line. Here in the graph I have used a technique writing Friction= C*Rw/Rw which is not smart way I think.
I am using mathcad prime 3.0
Best Regards
Jahangir Hossain
Solved! Go to Solution.
ACCEPTED SOLUTION
Accepted Solutions
Oct 13, 2014
06:33 AM
- Mark as New
- Bookmark
- Subscribe
- Mute
- Subscribe to RSS Feed
- Permalink
- Notify Moderator
Please log in to access translation
Oct 13, 2014
06:33 AM
Hi Jahangir
If its purely cosmetic then you have the option of moving the axis.
Just select the axis of interest and drag it to the new position required
Unless the data value exists it won't be plotted...you would need to account for the 0 values in your data vectors.
Thomas
10 REPLIES 10
Oct 13, 2014
05:39 AM
- Mark as New
- Bookmark
- Subscribe
- Mute
- Subscribe to RSS Feed
- Permalink
- Notify Moderator
Please log in to access translation
Oct 13, 2014
05:39 AM
Jahangir Hossain wrote:
Hi all,
I am making a graph for moments vs load radius..My Load radius start at 10.3m and hence the graph lines also start at that point (the vertical line in the document). But I want those lines to start from zero ( I mean y axis). How can I do so?
Your graph is plotted against LoadRadius (R.w) which starts from 10.3m, so it will not start from zero. You could make your functions dependant on R.w and define that as a range variable, but your vectors Wind and Trim only have 3 values realting to R.w, so these would need to interpolated.
I don't really understand why you are trying to start these lines at zero.
Oct 13, 2014
05:59 AM
- Mark as New
- Bookmark
- Subscribe
- Mute
- Subscribe to RSS Feed
- Permalink
- Notify Moderator
Please log in to access translation
Oct 13, 2014
05:59 AM
Thanks mike...
I am trying to start those lines at zero just because of representations(looking good).
Oct 13, 2014
06:15 AM
- Mark as New
- Bookmark
- Subscribe
- Mute
- Subscribe to RSS Feed
- Permalink
- Notify Moderator
Please log in to access translation
Oct 13, 2014
06:15 AM
Have a look at the attached. Sorry for the brute force method, but I haven't got the much time at the moment.
Oct 13, 2014
06:54 AM
- Mark as New
- Bookmark
- Subscribe
- Mute
- Subscribe to RSS Feed
- Permalink
- Notify Moderator
Please log in to access translation
Oct 13, 2014
06:54 AM
You could also make the first values in the vector zero in my example. Forgot to mention this.
Oct 13, 2014
06:33 AM
- Mark as New
- Bookmark
- Subscribe
- Mute
- Subscribe to RSS Feed
- Permalink
- Notify Moderator
Please log in to access translation
Oct 13, 2014
06:33 AM
Hi Jahangir
If its purely cosmetic then you have the option of moving the axis.
Just select the axis of interest and drag it to the new position required
Unless the data value exists it won't be plotted...you would need to account for the 0 values in your data vectors.
Thomas
Oct 13, 2014
06:58 AM
- Mark as New
- Bookmark
- Subscribe
- Mute
- Subscribe to RSS Feed
- Permalink
- Notify Moderator
Please log in to access translation
Oct 13, 2014
06:58 AM
Thank you thomas....
Oct 13, 2014
06:59 AM
- Mark as New
- Bookmark
- Subscribe
- Mute
- Subscribe to RSS Feed
- Permalink
- Notify Moderator
Please log in to access translation
Oct 13, 2014
06:59 AM
Could you please tell me how to put graph title and axis ttile?
Oct 13, 2014
07:05 AM
- Mark as New
- Bookmark
- Subscribe
- Mute
- Subscribe to RSS Feed
- Permalink
- Notify Moderator
Please log in to access translation
Oct 13, 2014
07:05 AM
I don't think these features have been included in Prime 3.0.
One option is to manually place a text box yourself.
Oct 13, 2014
07:15 AM
- Mark as New
- Bookmark
- Subscribe
- Mute
- Subscribe to RSS Feed
- Permalink
- Notify Moderator
Please log in to access translation
Oct 13, 2014
07:15 AM
Thanks mike again.. Thats a good option..
Oct 13, 2014
07:17 AM
- Mark as New
- Bookmark
- Subscribe
- Mute
- Subscribe to RSS Feed
- Permalink
- Notify Moderator
Please log in to access translation
Oct 13, 2014
07:17 AM
Jahangir Hossain wrote:
Thanks mike again.. Thats a good option..
No problem at all. It is a good workaround, not the best option as these features should be readily available.
Hopefully included in Prime 4.0 


