
Turn on suggestions
Auto-suggest helps you quickly narrow down your search results by suggesting possible matches as you type.
Showing results for
Please log in to access translation
Turn on suggestions
Auto-suggest helps you quickly narrow down your search results by suggesting possible matches as you type.
Showing results for
Community Tip - Learn all about the Community Ranking System, a fun gamification element of the PTC Community. X
Translate the entire conversation x
Please log in to access translation
Options
- Subscribe to RSS Feed
- Mark Topic as New
- Mark Topic as Read
- Float this Topic for Current User
- Bookmark
- Subscribe
- Mute
- Printer Friendly Page
GridLines in a Graph
Oct 06, 2015
05:55 AM
- Mark as New
- Bookmark
- Subscribe
- Mute
- Subscribe to RSS Feed
- Permalink
- Notify Moderator
Please log in to access translation
Oct 06, 2015
05:55 AM
GridLines in a Graph
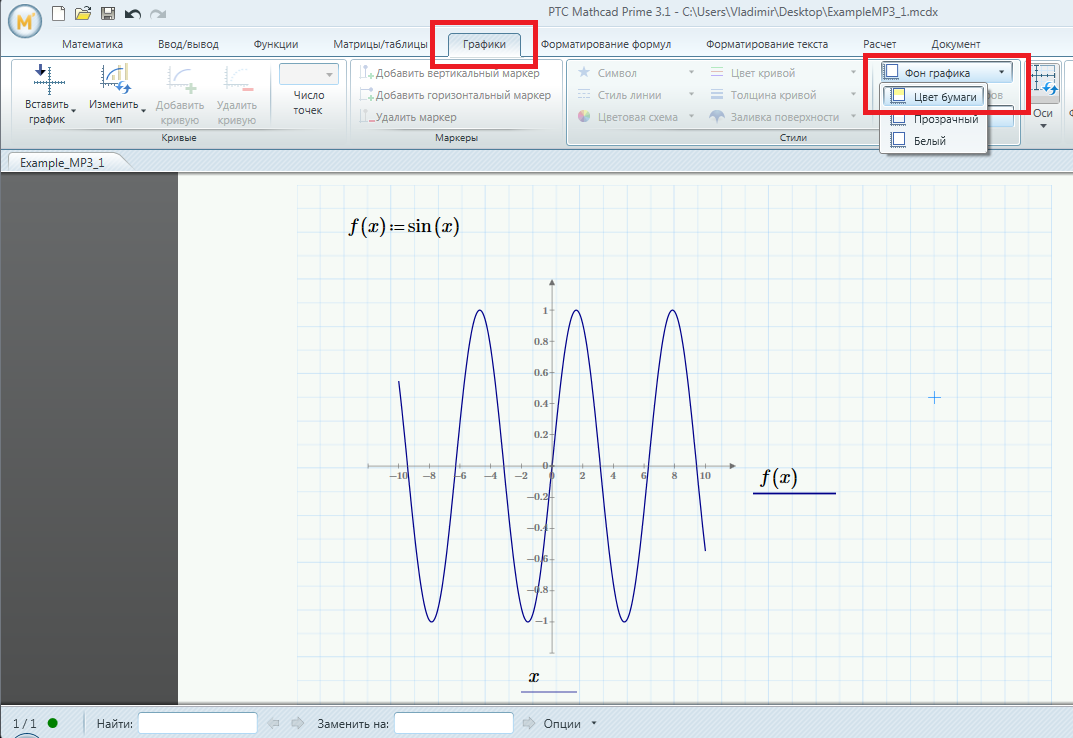
Can't find how to show Gridlines in a Graph, X-Y plot. Express Prime 3.1.
Labels:
- Labels:
-
Other
11 REPLIES 11
Oct 06, 2015
09:31 AM
- Mark as New
- Bookmark
- Subscribe
- Mute
- Subscribe to RSS Feed
- Permalink
- Notify Moderator
Please log in to access translation
Oct 06, 2015
09:31 AM
That's because they don't exist in Mathcad Prime.
Oct 06, 2015
09:41 AM
- Mark as New
- Bookmark
- Subscribe
- Mute
- Subscribe to RSS Feed
- Permalink
- Notify Moderator
Please log in to access translation
Oct 06, 2015
09:41 AM
ok, thank you.
May 14, 2016
07:09 PM
- Mark as New
- Bookmark
- Subscribe
- Mute
- Subscribe to RSS Feed
- Permalink
- Notify Moderator
Please log in to access translation
May 14, 2016
07:09 PM
This is ridiculous, they have always been able to plot the gridlines in the plot, and even the worst programs like Excel can graph with gridlines! PTC seems to ruin every software they buy out!
Apr 24, 2018
05:07 AM
- Mark as New
- Bookmark
- Subscribe
- Mute
- Subscribe to RSS Feed
- Permalink
- Notify Moderator
Please log in to access translation
Apr 24, 2018
05:07 AM
I agree completely. Was really thinking of acquiring this and am currently evaluating. But no gridlines on a plot is the last straw to add to a number of glaring deficiencies regarding fundamental application, even if compared to the ancient MathCAD 6. (1988-1995). Not at all impressed...
Oct 07, 2015
05:33 AM
- Mark as New
- Bookmark
- Subscribe
- Mute
- Subscribe to RSS Feed
- Permalink
- Notify Moderator
Please log in to access translation
Oct 07, 2015
05:33 AM
In this case, you can only use the document grid:
Oct 07, 2015
09:43 AM
- Mark as New
- Bookmark
- Subscribe
- Mute
- Subscribe to RSS Feed
- Permalink
- Notify Moderator
Please log in to access translation
Oct 07, 2015
09:43 AM
I need a logarithmic scale.
May 14, 2016
07:11 PM
- Mark as New
- Bookmark
- Subscribe
- Mute
- Subscribe to RSS Feed
- Permalink
- Notify Moderator
Please log in to access translation
May 14, 2016
07:11 PM
This makes no sense, the plot can be moved to any location with the gridlines not matching up with actual data, so the gridlines become useless/fake! Why would I pay $2K+ for software that cannot even plot simple gridlines FREE software will do!?
May 16, 2016
07:50 AM
- Mark as New
- Bookmark
- Subscribe
- Mute
- Subscribe to RSS Feed
- Permalink
- Notify Moderator
Please log in to access translation
May 16, 2016
07:50 AM
Why would I pay $2K+ for software that cannot even plot simple gridlines FREE software will do!?
Because if you buy Prime you get Mathcad 15 for free, and that has gridlines 
Oct 07, 2015
02:42 PM
- Mark as New
- Bookmark
- Subscribe
- Mute
- Subscribe to RSS Feed
- Permalink
- Notify Moderator
Please log in to access translation
Oct 07, 2015
02:42 PM
The thread is marked as "Assumed Answered", but you should not give up too soon.
It would be rather polite to say, that Primes plotting capabilities are mediocre - its much worse. But sometimes you can help yourself with some self defined utility functions.
Unfortunately you won't be able to use those function in Prime Express after the trial period, because programming is considered a premium feature by PTC and is disabled in Express mode.
As I usually use MC15 I just noticed, that logarithmic scale can only be applied to the ordinate axis! Seriously? That can't be true - am I missing something??
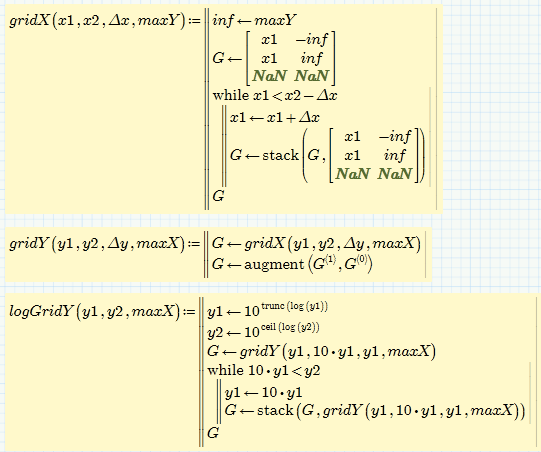
Anyway - here a some routines I just wrote (quick an dirty, not error checking, etc.) which can be used to provide some kind of grids.
The horizontal grid has to be of type "Waterfall Trace".
The vertical grid on has to be of type "Stem Trace" - no idea why Waterfall Trace does not do the job here.

Oct 08, 2015
04:16 AM
- Mark as New
- Bookmark
- Subscribe
- Mute
- Subscribe to RSS Feed
- Permalink
- Notify Moderator
Please log in to access translation
Oct 08, 2015
04:16 AM
Thank you, Werner.
Oct 08, 2015
04:25 AM
- Mark as New
- Bookmark
- Subscribe
- Mute
- Subscribe to RSS Feed
- Permalink
- Notify Moderator
Please log in to access translation
Oct 08, 2015
04:25 AM
Thanks. I can do my task in this way. Sorry for bad English.


