Community Tip - New to the community? Learn how to post a question and get help from PTC and industry experts! X
- Subscribe to RSS Feed
- Mark Topic as New
- Mark Topic as Read
- Float this Topic for Current User
- Bookmark
- Subscribe
- Mute
- Printer Friendly Page
HOW TO CREATE A HISTOGRAM USING GENERATED DATA
- Mark as New
- Bookmark
- Subscribe
- Mute
- Subscribe to RSS Feed
- Permalink
- Notify Moderator
HOW TO CREATE A HISTOGRAM USING GENERATED DATA
The attached mathcad code will generate a sample of m = 1000 values. I would like to create a histogram or curve of the data. Kindly assist. I want to verify if the data generated is normal. Thank you.
Solved! Go to Solution.
- Labels:
-
Mathcad Usage
-
Statistics_Analysis
Accepted Solutions
- Mark as New
- Bookmark
- Subscribe
- Mute
- Subscribe to RSS Feed
- Permalink
- Notify Moderator
Maybe this version is what you're looking for...and the link for on-line help is here: Histogram Plot Process
- Mark as New
- Bookmark
- Subscribe
- Mute
- Subscribe to RSS Feed
- Permalink
- Notify Moderator
- Mark as New
- Bookmark
- Subscribe
- Mute
- Subscribe to RSS Feed
- Permalink
- Notify Moderator
Thanks Raiko. Not really. The y-axis should be proportion of X.
- Mark as New
- Bookmark
- Subscribe
- Mute
- Subscribe to RSS Feed
- Permalink
- Notify Moderator
Maybe this version is what you're looking for...and the link for on-line help is here: Histogram Plot Process
- Mark as New
- Bookmark
- Subscribe
- Mute
- Subscribe to RSS Feed
- Permalink
- Notify Moderator
Thanks Chris. That is better. I think I can modify it to get what I am looking for. I expect the histogram to be bellshaped (normal)
- Mark as New
- Bookmark
- Subscribe
- Mute
- Subscribe to RSS Feed
- Permalink
- Notify Moderator
Thanks, Chris. That is what I am looking for.
- Mark as New
- Bookmark
- Subscribe
- Mute
- Subscribe to RSS Feed
- Permalink
- Notify Moderator
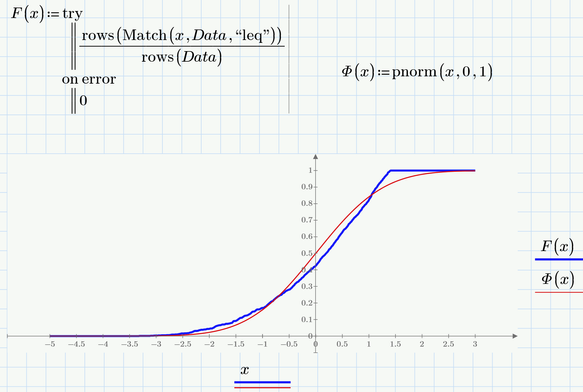
Comparing the cumulative distribution of your data with that of a standard 0,1-normal distribution shows, that your data seems not to follow a normal distribution.
The histogram shows this as well and you may also use the function "kurt" and "skew" with your data to test against a normal distribution.


