Community Tip - If community subscription notifications are filling up your inbox you can set up a daily digest and get all your notifications in a single email. X
- Subscribe to RSS Feed
- Mark Topic as New
- Mark Topic as Read
- Float this Topic for Current User
- Bookmark
- Subscribe
- Mute
- Printer Friendly Page
Help needed for FFT
- Mark as New
- Bookmark
- Subscribe
- Mute
- Subscribe to RSS Feed
- Permalink
- Notify Moderator
Help needed for FFT
Hello fellow MCs
I've got a problem with an audio signal. MC either refuses to perform a FFT or to plot claiming that it either has too many data points or some error occurs. Can anybody help me on this?
Thanks
Raiko
P.S.
I'm running MC 15 (M010) on a 64 bit Win 7 machine. The files are added
Solved! Go to Solution.
- Labels:
-
Statistics_Analysis
Accepted Solutions
- Mark as New
- Bookmark
- Subscribe
- Mute
- Subscribe to RSS Feed
- Permalink
- Notify Moderator
I assume (from your file) that you can actually read in the file. (My version 14.0 won't even do that.)
Note that FFT?IFFT and fft/ifft require a vector with 2^m values. Try CFFT instead of FFT.
- Mark as New
- Bookmark
- Subscribe
- Mute
- Subscribe to RSS Feed
- Permalink
- Notify Moderator
I assume (from your file) that you can actually read in the file. (My version 14.0 won't even do that.)
Note that FFT?IFFT and fft/ifft require a vector with 2^m values. Try CFFT instead of FFT.
- Mark as New
- Bookmark
- Subscribe
- Mute
- Subscribe to RSS Feed
- Permalink
- Notify Moderator
Hello Fred,
this did the trick. I figured out that MC 15 has also a problem with the amount of data points - close to 2 mio in my case. Half of that worked as there still is enough of the signal information in this subset.
However, I have a new problem now. When I try to identify the main frequency I get weird results.
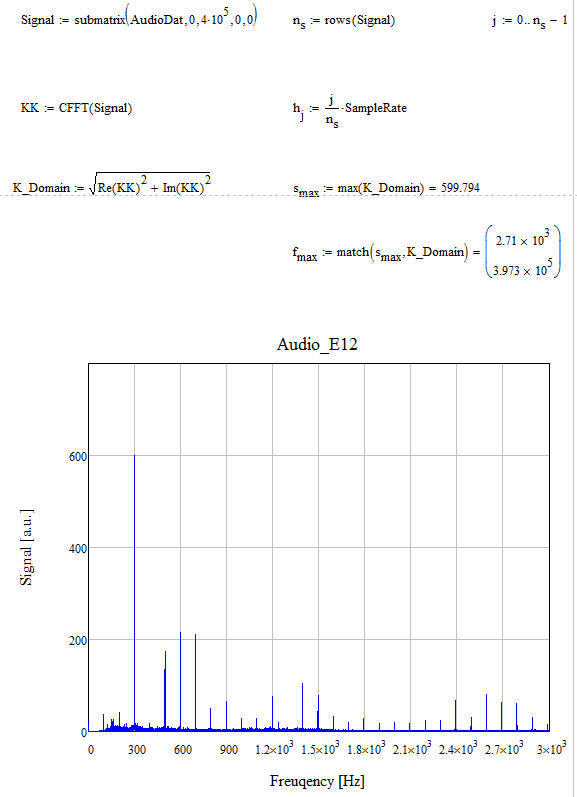
#1 I do a CFFT on a subset of the signal - about 50%
#2 frequency is determined by using sample rate and number of points. This yileds a plot in the frequency domain.
#3 for determining the main frequency I find the max value via max and correlate that to the CFFT by using MATCh or LOOKUP. It should be 300 Hz, but I get 2710 Hz; s ee image.
Raiko
- Mark as New
- Bookmark
- Subscribe
- Mute
- Subscribe to RSS Feed
- Permalink
- Notify Moderator
With the full data set I get 298.653. See attached.
Alan
- Mark as New
- Bookmark
- Subscribe
- Mute
- Subscribe to RSS Feed
- Permalink
- Notify Moderator
If I split the data into eight segments (timewise) it becomes more manageable. While the amplitudes increase the frequencies don't appear to shift. You can pick the frequency off the graph or sort the FFt vector. Note that CFFT has the reflected parts of the fft. t get the proper frequency of the ampllitudes, throw the top half of the CFFt vector out before sorting it.
- Mark as New
- Bookmark
- Subscribe
- Mute
- Subscribe to RSS Feed
- Permalink
- Notify Moderator
Hello Fred,
thank you very much for your help. I'm not certain I understand everything you did as I'm a novice to FFT. 😉
However, my collegue, for whom I'm doing this, bugs me that the main frequency should be at 100 Hz. He compared the audiosignal to a frequency generator output and it sound squite similar. Is there any chance that the FFT is off by a factor of 3?
Thanks in advance
Raiko
- Mark as New
- Bookmark
- Subscribe
- Mute
- Subscribe to RSS Feed
- Permalink
- Notify Moderator
Raiko,
The frequency step for an FFT depends on the sapling frequency ("SampleRate" for you) and the number of samples.
When (in your original sheet) you took every ninth value you were effectively altering the sampling rate. (Your "revised" sampling rate was 1/9th the original sampling rate.
So, no, if you have read the sampling rate correctly then the frequency is as plotted.
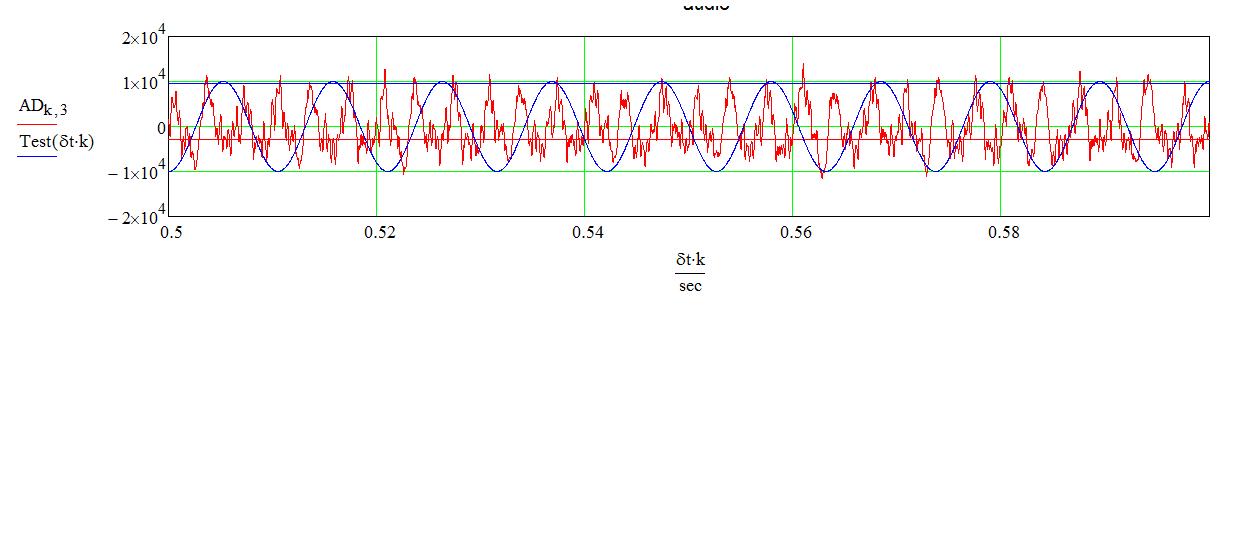
Now! If I divide the sample rate quoted by pi, we get a frequency of 95 Hz for the first peak. And if I plot a 95 Hz signal (see attached) on top of the test signal, it lines up pretty well. So I agree with your colleague that the signal is about 100 Hz (actually 95.)
I'll leave you to figure out why the sample rate is wrong!
- Mark as New
- Bookmark
- Subscribe
- Mute
- Subscribe to RSS Feed
- Permalink
- Notify Moderator
Just for giggles I hunted out a different WAV file and stuffed it through the same sheet. There's only enough signal for one pass, and the resolution is not good (see the reconstructed signal at the end), but it does verify the "divide by pi" correction to sampling rate.
- Mark as New
- Bookmark
- Subscribe
- Mute
- Subscribe to RSS Feed
- Permalink
- Notify Moderator
Hello Fred,
you see me red eyed this morning. I don't get it why I still have 300 Hz although I do understand now that the sample rate is influeneced when I'm reducing the original signal by extracting every nth data point.
However, in this sheet I'm taking simply the first half of the data hence the sample frequency should remain unaltered. Still 300 Hz.See attached sheet.
Why do you divide the frequency by Pi? This indicates that the data might contain an angular frequency and then are still off by a factor of 2.
Raiko
- Mark as New
- Bookmark
- Subscribe
- Mute
- Subscribe to RSS Feed
- Permalink
- Notify Moderator
Raiko;
My apologies! You're right--what I sent you above had a mistake; if I divide the sampling frequency by pi of course it will shift the apparent signal. When I remove that division and make a comparison to a true 100 Hz signal I can verify what you said, the signal you're analyzing is predominately 300 Hz.

That does not explain your colleague's audio comparison. But the human ear is a strange thing.
- Mark as New
- Bookmark
- Subscribe
- Mute
- Subscribe to RSS Feed
- Permalink
- Notify Moderator
After finding my mistake above it occurred to me that there was another check: the DTMF file I posted after. The DTMF frequencies are common knowledge.
Sure enough, removing the pi error from that file resulted in the frequency pair of 941 Hz and 1477 Hz, the code for "#".
- Mark as New
- Bookmark
- Subscribe
- Mute
- Subscribe to RSS Feed
- Permalink
- Notify Moderator
Raiko,
I can't open your file since I'm limited to mathcad 11 at the moment. Here's my suggestion.
Your problem could also simply have to do with the number of data points you're trying to plot. That is restricted to some 200,000. Test that by trying to plot or display a tiny subset of your results.
Success!
Luc
- Mark as New
- Bookmark
- Subscribe
- Mute
- Subscribe to RSS Feed
- Permalink
- Notify Moderator
Is the attached any use? (I used M15 (F000), Win 7, 64 bit) I changed the path to the data file in my working version, but have reinstated your path in the attached.
Alan
- Mark as New
- Bookmark
- Subscribe
- Mute
- Subscribe to RSS Feed
- Permalink
- Notify Moderator
Alan,
You can take the FFT of the full vector (using CFFT), you just can't plot the whole result at one time.
Looking at the signal, though, it might be interesting to slice out pieces and FFT each piece seperately.
- Mark as New
- Bookmark
- Subscribe
- Mute
- Subscribe to RSS Feed
- Permalink
- Notify Moderator
Fred,
You are probably right, but I got fed up waiting for the CFFT to calculate when I tried it (a couple of minutes is the limit of my patience these days!). It wouldn't stop when I pressed Esc either - I had to resort to Ctrl-Alt-Del!
Alan
- Mark as New
- Bookmark
- Subscribe
- Mute
- Subscribe to RSS Feed
- Permalink
- Notify Moderator
Interressting! CFFT ran in less than 5 sec for me. I'll have to look closer. . .
- Mark as New
- Bookmark
- Subscribe
- Mute
- Subscribe to RSS Feed
- Permalink
- Notify Moderator
Fred Kohlhepp wrote:
Interressting! CFFT ran in less than 5 sec for me. I'll have to look closer. . .
You're right! Just tried it again and it was extremely quick. I must have got something wrong (a common occurrence!) when I tried it before.
Alan


