
Turn on suggestions
Auto-suggest helps you quickly narrow down your search results by suggesting possible matches as you type.
Showing results for
Please log in to access translation
Turn on suggestions
Auto-suggest helps you quickly narrow down your search results by suggesting possible matches as you type.
Showing results for
Community Tip - New to the community? Learn how to post a question and get help from PTC and industry experts! X
Translate the entire conversation x
Please log in to access translation
Options
- Subscribe to RSS Feed
- Mark Topic as New
- Mark Topic as Read
- Float this Topic for Current User
- Bookmark
- Subscribe
- Mute
- Printer Friendly Page
Hepl to make a graph with 3 positive variables
Jan 08, 2015
01:26 AM
- Mark as New
- Bookmark
- Subscribe
- Mute
- Subscribe to RSS Feed
- Permalink
- Notify Moderator
Please log in to access translation
Jan 08, 2015
01:26 AM
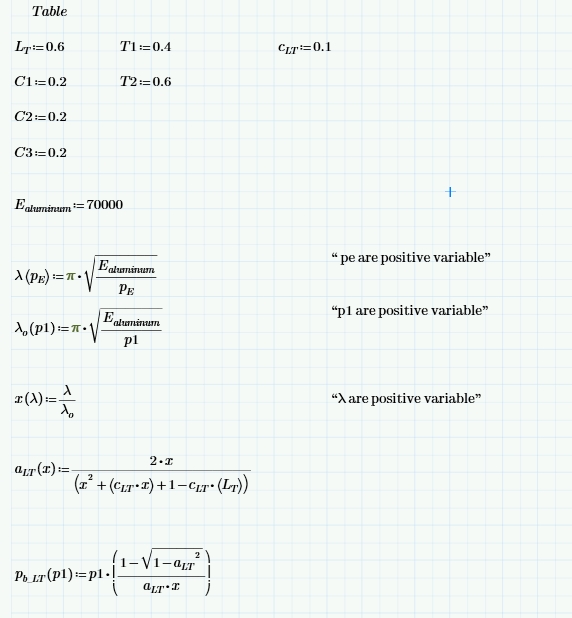
Hepl to make a graph with 3 positive variables
Is this 3 positive variables in a equation are possible to make a graph ?. please help me to solve this in Math CAd prime. I also attached the MATHCAD prime spreadsheet.
Solved! Go to Solution.
Labels:
- Labels:
-
Other
ACCEPTED SOLUTION
Accepted Solutions
Jan 08, 2015
04:42 AM
- Mark as New
- Bookmark
- Subscribe
- Mute
- Subscribe to RSS Feed
- Permalink
- Notify Moderator
Please log in to access translation
Jan 08, 2015
04:42 AM
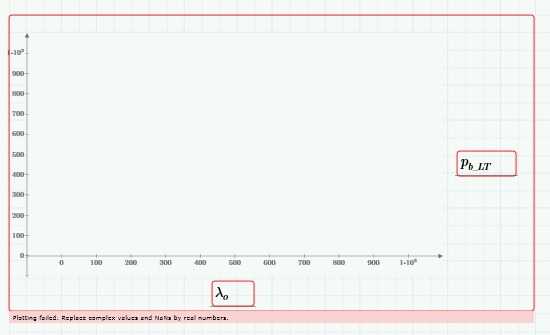
Not sure that it's the most esthetic way of doing, but this does *something*.
I am not an expert, but I think you have to (and even if you don't have to, at least, it works this way) use the "fundamental" variables that your stuff are built on to define everything (here, pe and p1, not x and alt).
You also have to define them as range variable for plotting (it might assume range variable on its own, but I wouldn't let the software make that decision for me). In you particular case, you don't have much choise, because the function you want to plot are functions of more than one variable, so I doubt that Mathcad can decide on its own which one you want to do you plot against.
2 REPLIES 2
Jan 08, 2015
04:42 AM
- Mark as New
- Bookmark
- Subscribe
- Mute
- Subscribe to RSS Feed
- Permalink
- Notify Moderator
Please log in to access translation
Jan 08, 2015
04:42 AM
Not sure that it's the most esthetic way of doing, but this does *something*.
I am not an expert, but I think you have to (and even if you don't have to, at least, it works this way) use the "fundamental" variables that your stuff are built on to define everything (here, pe and p1, not x and alt).
You also have to define them as range variable for plotting (it might assume range variable on its own, but I wouldn't let the software make that decision for me). In you particular case, you don't have much choise, because the function you want to plot are functions of more than one variable, so I doubt that Mathcad can decide on its own which one you want to do you plot against.
Jan 08, 2015
07:53 AM
- Mark as New
- Bookmark
- Subscribe
- Mute
- Subscribe to RSS Feed
- Permalink
- Notify Moderator
Please log in to access translation
Jan 08, 2015
07:53 AM
Problem solved thank you !


