
Turn on suggestions
Auto-suggest helps you quickly narrow down your search results by suggesting possible matches as you type.
Showing results for
Please log in to access translation
Turn on suggestions
Auto-suggest helps you quickly narrow down your search results by suggesting possible matches as you type.
Showing results for
Community Tip - Have a PTC product question you need answered fast? Chances are someone has asked it before. Learn about the community search. X
Translate the entire conversation x
Please log in to access translation
Options
- Subscribe to RSS Feed
- Mark Topic as New
- Mark Topic as Read
- Float this Topic for Current User
- Bookmark
- Subscribe
- Mute
- Printer Friendly Page
How can I graph in this situation?
Dec 07, 2014
11:26 PM
- Mark as New
- Bookmark
- Subscribe
- Mute
- Subscribe to RSS Feed
- Permalink
- Notify Moderator
Please log in to access translation
Dec 07, 2014
11:26 PM
How can I graph in this situation?
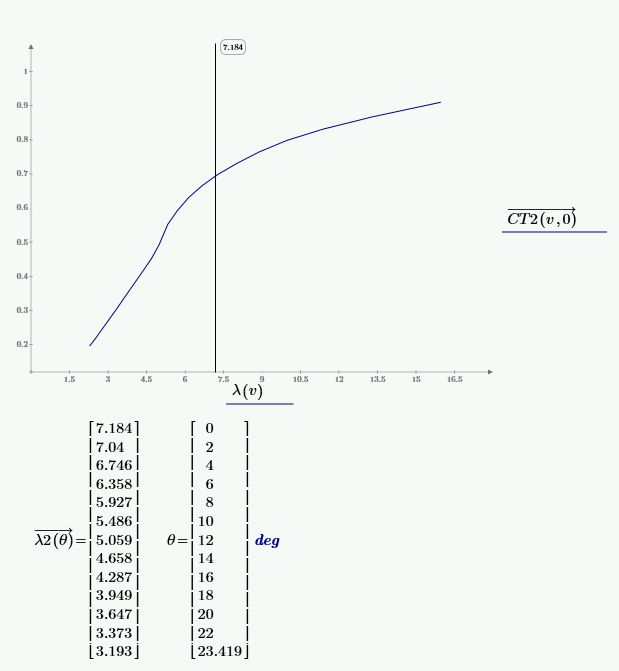
you can see a line in this picture.
I need to change data on the left side in a line.
this data is under a graph. lamda is changed depending on "theta"
it means that graph on the left side in a line will be changed because other data are applied.
I tried to apply it several times, but I failed contunally.. could you help me?
I want to graph automatically such as upper a picture.
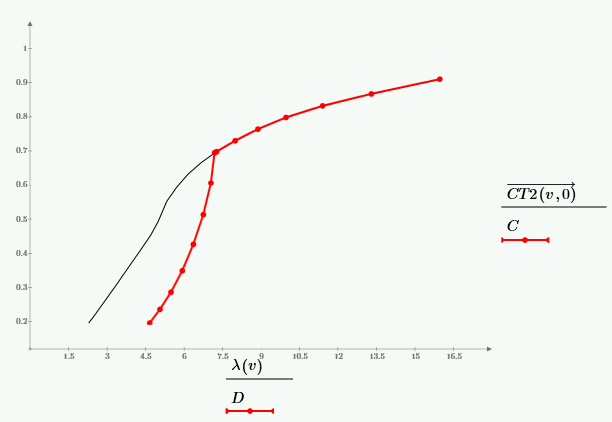
This is picture that I graph manually.
Labels:
- Labels:
-
Statistics_Analysis
6 REPLIES 6
Dec 08, 2014
04:58 AM
- Mark as New
- Bookmark
- Subscribe
- Mute
- Subscribe to RSS Feed
- Permalink
- Notify Moderator
Please log in to access translation
Dec 08, 2014
04:58 AM
I don't see any theta in the graph or in functions and arguments involved.
The argument of lamda seems to be some kind of velocity, the argument of lamda2 is an angle.
Dec 08, 2014
05:09 AM
- Mark as New
- Bookmark
- Subscribe
- Mute
- Subscribe to RSS Feed
- Permalink
- Notify Moderator
Please log in to access translation
Dec 08, 2014
05:09 AM
my graph indicate theta in CT2(v,0). 0 is theta.
"v" and "theta" are functions about CT2. I just expressed CT(v,0) becasue I want to graph a curve in case of CT(v,0)
the argument of lamda2 is an angle>>>you said
the argument of lamda2 is "theta"
I attached my file
Dec 08, 2014
05:41 AM
- Mark as New
- Bookmark
- Subscribe
- Mute
- Subscribe to RSS Feed
- Permalink
- Notify Moderator
Please log in to access translation
Dec 08, 2014
05:41 AM
This does not help determining what you are trying to do.
If you want lamda to change when theta changes, you have to make lambda dependent on theta, so lambda would be a function lambda(v, theta).
Dec 08, 2014
06:11 AM
- Mark as New
- Bookmark
- Subscribe
- Mute
- Subscribe to RSS Feed
- Permalink
- Notify Moderator
Please log in to access translation
Dec 08, 2014
06:11 AM
So Do you mean that I can't make automatically red curve??
Dec 08, 2014
07:29 AM
- Mark as New
- Bookmark
- Subscribe
- Mute
- Subscribe to RSS Feed
- Permalink
- Notify Moderator
Please log in to access translation
Dec 08, 2014
07:29 AM
jinsuk Lee wrote:
So Do you mean that I can't make automatically red curve??
I don't know as I don't know what we see in that red curve. But isn't it that what you wanted?
Dec 09, 2014
03:18 AM
- Mark as New
- Bookmark
- Subscribe
- Mute
- Subscribe to RSS Feed
- Permalink
- Notify Moderator
Please log in to access translation
Dec 09, 2014
03:18 AM
Yes, I want to be expressed red curve automatically.


