Community Tip - When posting, your subject should be specific and summarize your question. Here are some additional tips on asking a great question. X
- Subscribe to RSS Feed
- Mark Topic as New
- Mark Topic as Read
- Float this Topic for Current User
- Bookmark
- Subscribe
- Mute
- Printer Friendly Page
How do I improve the fitting results within the range close to zero with Minerr
- Mark as New
- Bookmark
- Subscribe
- Mute
- Subscribe to RSS Feed
- Permalink
- Notify Moderator
How do I improve the fitting results within the range close to zero with Minerr
Hello, everyone,
I met with a problem of fitting data of adsorption experiments (3 parameters - P1,P2 and P3(or beta) ), and I did it with Minerr function, but the results near 0 are needed to be improved. Could anyone teach me?
the results given by Orgin is shown below.
the mathcad file (ver. 11) is also attached
Solved! Go to Solution.
- Labels:
-
Statistics_Analysis
Accepted Solutions
- Mark as New
- Bookmark
- Subscribe
- Mute
- Subscribe to RSS Feed
- Permalink
- Notify Moderator
If you replace the n^2 with i^2 in both exponential terms you will get a better fit (it means Werner's speed-up method is no longer valid though).
(Werner's method of directly equating y with Rate within the solve block is still to be preferred.)
Alan
- Mark as New
- Bookmark
- Subscribe
- Mute
- Subscribe to RSS Feed
- Permalink
- Notify Moderator
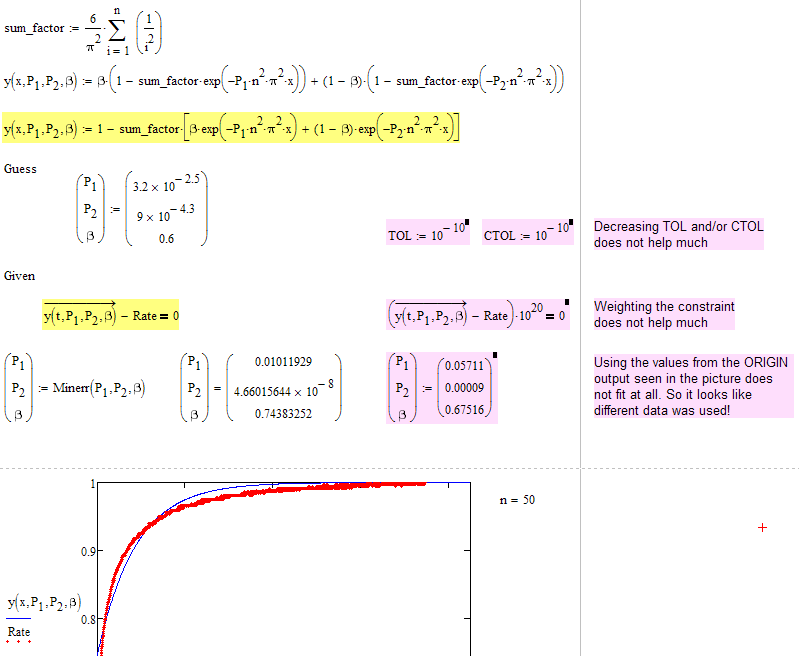
I cant help with improving the fit and I am not sure, if a better fit using the model function you provide is possible at all. The output of Origin seems to depend on different data and maybe a different model - we can't see.
The usual tricks like decreasing TOL and/or CTOL and weighting the constraints don't make for much change.
But in any case you can speed up calculation in Mathcad by simplifying you function y() using a precalculated sum.
Furthermore you don't need your function Residual with its for-loop if you make use of vectorisation:

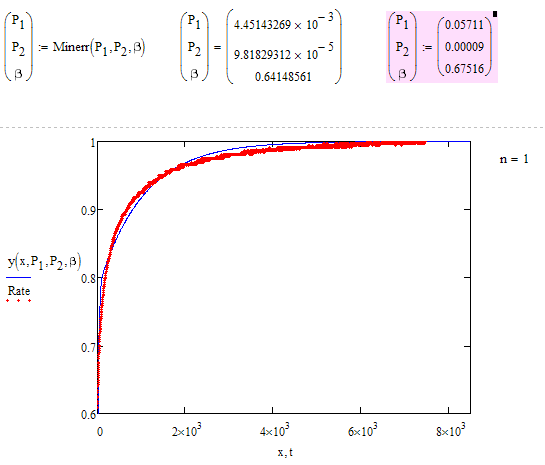
BTW, it looks to me that n=1 gives a better fit which looks more close to what ORIGIN provided:

- Mark as New
- Bookmark
- Subscribe
- Mute
- Subscribe to RSS Feed
- Permalink
- Notify Moderator
If you replace the n^2 with i^2 in both exponential terms you will get a better fit (it means Werner's speed-up method is no longer valid though).
(Werner's method of directly equating y with Rate within the solve block is still to be preferred.)
Alan
- Mark as New
- Bookmark
- Subscribe
- Mute
- Subscribe to RSS Feed
- Permalink
- Notify Moderator
I have looked through the very original reference article,and found that you are right, thx a lot
- Mark as New
- Bookmark
- Subscribe
- Mute
- Subscribe to RSS Feed
- Permalink
- Notify Moderator
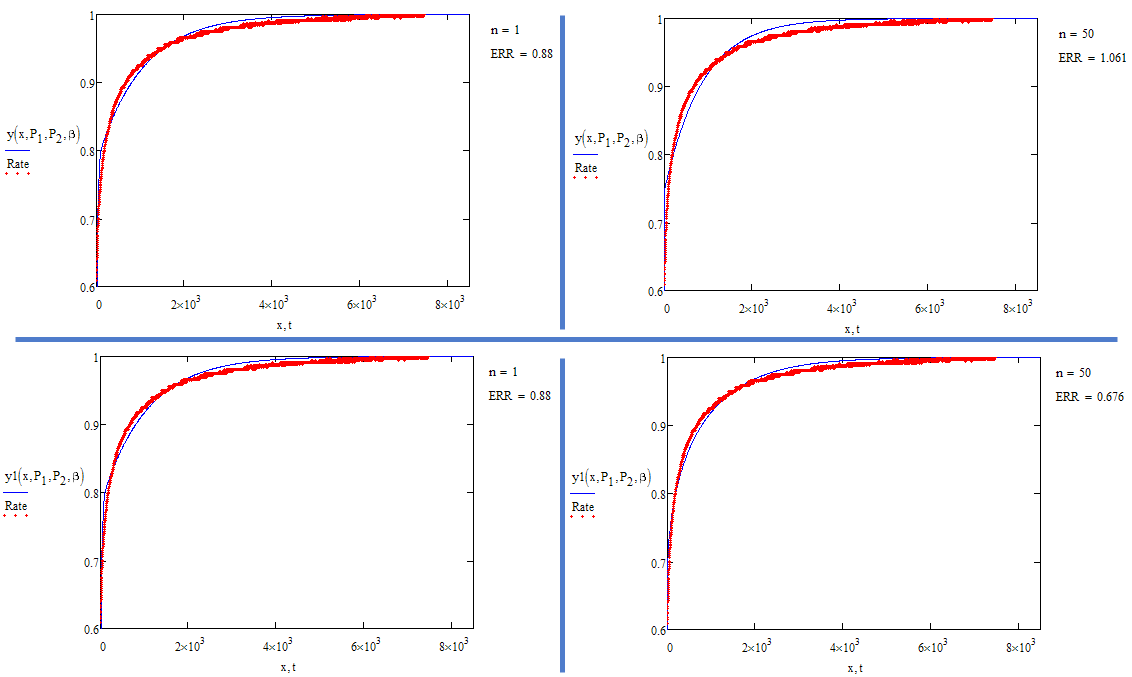
Here you see your model (y) and Alans suggestion (y1) in comparison (with n=2 they are the same, of course). Note the value of ERR.
I noticed that when I try to load the file I posted I get an error because the data definition is corrupt. So I defined the data in a different way in the attached file and saved it in MC11 format this time.

- Mark as New
- Bookmark
- Subscribe
- Mute
- Subscribe to RSS Feed
- Permalink
- Notify Moderator
BTW, it may not be what you are looking for, but you get a far better fit using a Weibull regression. You my either use genfit

or as you did using minerr (look at ERR)

Werner
- Mark as New
- Bookmark
- Subscribe
- Mute
- Subscribe to RSS Feed
- Permalink
- Notify Moderator
many thanks
I have rewrite my code and use the vector symbol to simplify my cal sheet.
- Mark as New
- Bookmark
- Subscribe
- Mute
- Subscribe to RSS Feed
- Permalink
- Notify Moderator
- Mark as New
- Bookmark
- Subscribe
- Mute
- Subscribe to RSS Feed
- Permalink
- Notify Moderator
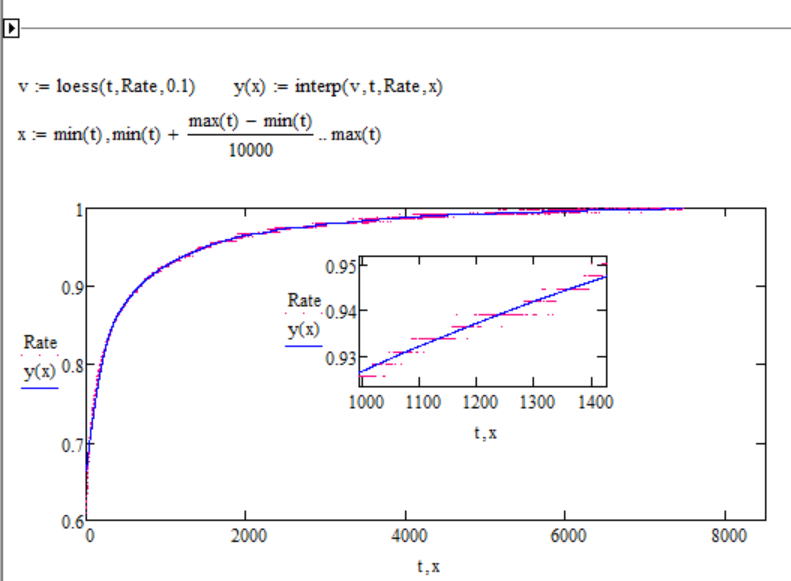
It looks to me like Fan CG is looking for a regression function and maybe even a very specific one - not a simple interpolation. But I may be wrong about that.
- Mark as New
- Bookmark
- Subscribe
- Mute
- Subscribe to RSS Feed
- Permalink
- Notify Moderator
It looks to me as though there is a discontinuity in the Origin graph, just below 0.8 on the y-axis. The exponential curve appears to change into a straight line at that point, which is then drawn to x=0, y=0. It's hard to tell from a bitmap image, so I could be wrong, but if my eye follows the trend of the exponential curve then it looks to me like it should do what yours does, and intercept the y-axis at about 0.75.
The initial, steep, part of the curve has very few points compared to the rest of the curve, so it has limited influence on the fit. You can give it greater influence by weighting the residuals, but the price you pay is a worse fit elsewhere. The data just does not seem to be well represented by the model.


