
Turn on suggestions
Auto-suggest helps you quickly narrow down your search results by suggesting possible matches as you type.
Showing results for
Please log in to access translation
Turn on suggestions
Auto-suggest helps you quickly narrow down your search results by suggesting possible matches as you type.
Showing results for
Community Tip - Learn all about PTC Community Badges. Engage with PTC and see how many you can earn! X
Translate the entire conversation x
Please log in to access translation
Options
- Subscribe to RSS Feed
- Mark Topic as New
- Mark Topic as Read
- Float this Topic for Current User
- Bookmark
- Subscribe
- Mute
- Printer Friendly Page
How to Prepare Logarithmic graph as per the attachment
Mar 02, 2020
03:01 AM
- Mark as New
- Bookmark
- Subscribe
- Mute
- Subscribe to RSS Feed
- Permalink
- Notify Moderator
Please log in to access translation
Mar 02, 2020
03:01 AM
How to Prepare Logarithmic graph as per the attachment
How to prepare the graph as per the attachment
version mathcad prime 3.1
Regards,
Robert

Labels:
14 REPLIES 14
Mar 02, 2020
05:28 AM
- Mark as New
- Bookmark
- Subscribe
- Mute
- Subscribe to RSS Feed
- Permalink
- Notify Moderator
Please log in to access translation

Mar 02, 2020
06:29 AM
- Mark as New
- Bookmark
- Subscribe
- Mute
- Subscribe to RSS Feed
- Permalink
- Notify Moderator
Please log in to access translation
Mar 02, 2020
06:29 AM
Thank you for your reply.
I don't know how to take the valve fro the graph for our further calculation.
refer the attached calculation.
Mar 02, 2020
07:29 AM
- Mark as New
- Bookmark
- Subscribe
- Mute
- Subscribe to RSS Feed
- Permalink
- Notify Moderator
Please log in to access translation
Mar 02, 2020
07:29 AM
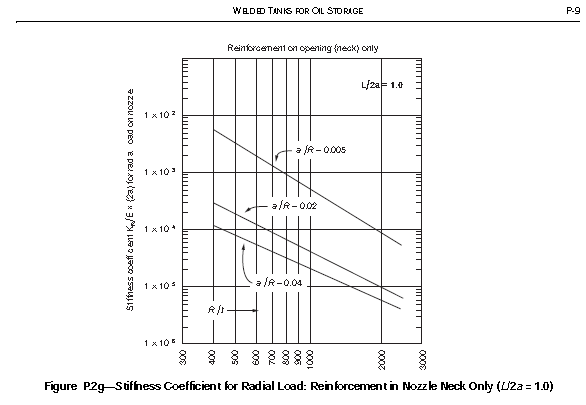
Your graph is describing a relationship for multiple variables (a/R and R/t.) What article or text are you extracting this from?
Mar 02, 2020
07:31 AM
- Mark as New
- Bookmark
- Subscribe
- Mute
- Subscribe to RSS Feed
- Permalink
- Notify Moderator
Please log in to access translation
Mar 02, 2020
07:31 AM
API 650 Annex-P - External Nozzle load analysis
- Tags:
- 650
Mar 02, 2020
09:40 AM
- Mark as New
- Bookmark
- Subscribe
- Mute
- Subscribe to RSS Feed
- Permalink
- Notify Moderator
Please log in to access translation
Mar 02, 2020
09:40 AM
Okay. Sorry, it took a while to locate a readable version of your document.
There doesn't appear to be any equation that develops these graphs which was what I was hoping for because that's what Mathcad does best. So we're stuck having to "brute force" this. I used WebPlotDigitizer(TM) to pick end points from the three lines in your plot. (I may not have been terribly accurate.) The attached file shows those values and recreates the plot in Mathcad (Prime 6.0).
Since the graph is a log-log, I suggest you do linear interpolation of the logs, I put in one equation (for a/R = 0.04), my Express won't run linterp, but you should get the correct value in full Prime.
It's not pretty, but it's one way. This would give you three points on a S vs a/R plot so you could interpolate that curve (suggest polyfit?)
Good luck
Mar 02, 2020
03:34 PM
- Mark as New
- Bookmark
- Subscribe
- Mute
- Subscribe to RSS Feed
- Permalink
- Notify Moderator
Please log in to access translation
Mar 02, 2020
03:44 PM
- Mark as New
- Bookmark
- Subscribe
- Mute
- Subscribe to RSS Feed
- Permalink
- Notify Moderator
Please log in to access translation
Mar 02, 2020
03:44 PM
Luc, thanks for the conversion!
I went ahead and taught Express to finish the job. Attached is 6.0 file and pdf.
Mar 02, 2020
04:02 PM
- Mark as New
- Bookmark
- Subscribe
- Mute
- Subscribe to RSS Feed
- Permalink
- Notify Moderator
Please log in to access translation
Mar 02, 2020
11:16 PM
- Mark as New
- Bookmark
- Subscribe
- Mute
- Subscribe to RSS Feed
- Permalink
- Notify Moderator
Please log in to access translation
Mar 02, 2020
11:16 PM
Hi,
Thank you for your immediate help.
Mar 02, 2020
11:17 PM
- Mark as New
- Bookmark
- Subscribe
- Mute
- Subscribe to RSS Feed
- Permalink
- Notify Moderator
Please log in to access translation
Mar 02, 2020
11:17 PM
Thank you for immediate help.
- Tags:
- ank
Mar 03, 2020
12:30 AM
- Mark as New
- Bookmark
- Subscribe
- Mute
- Subscribe to RSS Feed
- Permalink
- Notify Moderator
Please log in to access translation
Mar 03, 2020
12:30 AM
Hi,
How to arrive the below mentioned values from the graph

Mar 03, 2020
08:03 AM
- Mark as New
- Bookmark
- Subscribe
- Mute
- Subscribe to RSS Feed
- Permalink
- Notify Moderator
Please log in to access translation
Mar 03, 2020
08:03 AM
There are a number of digitizing programs available on the web. For this I used WebPlotDigitizer (a Google search should find it.) Before computers and images on the screen we used to use our eyes and read the numbers from the graph.
Please note that FWK_2_logplot is WRONG; the vector of a_R has it's values inverted from what they should be. Attached is FWK_2a_logplot that has had that corrected and the presentation cleaned up and neatened,
Mar 03, 2020
01:36 PM
- Mark as New
- Bookmark
- Subscribe
- Mute
- Subscribe to RSS Feed
- Permalink
- Notify Moderator
Please log in to access translation
Mar 03, 2020
11:26 PM
- Mark as New
- Bookmark
- Subscribe
- Mute
- Subscribe to RSS Feed
- Permalink
- Notify Moderator
Please log in to access translation
Mar 03, 2020
11:26 PM
Thanks boss


