Community Tip - When posting, your subject should be specific and summarize your question. Here are some additional tips on asking a great question. X
- Subscribe to RSS Feed
- Mark Topic as New
- Mark Topic as Read
- Float this Topic for Current User
- Bookmark
- Subscribe
- Mute
- Printer Friendly Page
How to convert vectors to scalars in MathCAD Prime 6
- Mark as New
- Bookmark
- Subscribe
- Mute
- Subscribe to RSS Feed
- Permalink
- Notify Moderator
How to convert vectors to scalars in MathCAD Prime 6

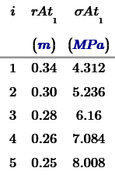
Second column is the radial break at different tensile strengths from a detonating blasthole
Third column is the value of tensile stress for radial break of column two,
This is the formula that uses the above input to calculate the number of cracks at each tensile strength for each radial distance away from the blasthole.
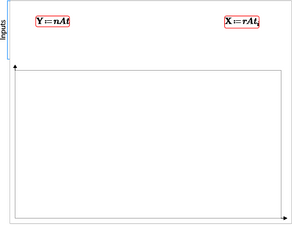
I am using the chart component to plot the number of cracks for each break radius. How do I set up Y and X to get a plot? I believe I need to change the vectors to scalars. I have posted my worksheet. Please refer to page 2 only.
Solved! Go to Solution.
- Labels:
-
Physics
Accepted Solutions
- Mark as New
- Bookmark
- Subscribe
- Mute
- Subscribe to RSS Feed
- Permalink
- Notify Moderator
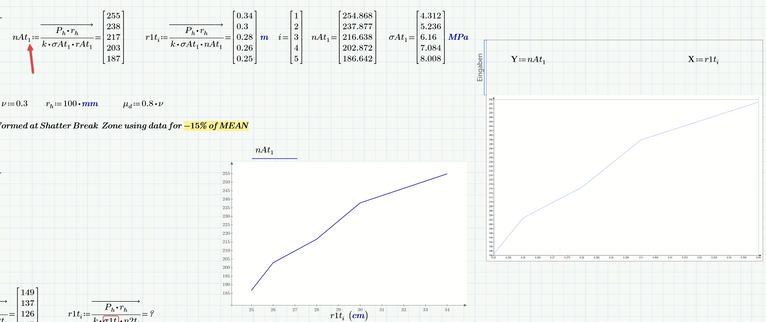
When you defined your vectors nAt.1 and others you used vector subscripts and so you defined a nested vector - a 1x1 vector whose only element is this 5x1 vector. The plot component did not like this for some reason.
I don't think that this was done intentionally by you- So just use a literal subscript and the component is happy.
I guess the component was placed a bit too high and I had to drag it down a little bit so it recognizes the variables defined to the left of it (Prime read left to right and from top down).
I also included the same plot done with Primes native plot facility (no labels, no grid lines, no secondary y-axis) to show that, unlike the purchased third party plot component, it at least also supports units (note the cm at the x-axis).
Prime 6 file attached
- Mark as New
- Bookmark
- Subscribe
- Mute
- Subscribe to RSS Feed
- Permalink
- Notify Moderator
Chris Preston P.Eng MCP
Consulting Engineer - Professional Engineers Ontario,
VP Research and Development - iRing INC, Nexco INC
T: 1 (705) 840-6000 x 249 C: 1 (705) 492-9773 F: 1 (705) 840-6001
E: chris.preston@iring.ca
The Next Generation of Underground Blasting Software
[cid:image001.png@01D69747.AF8EC590]


