Community Tip - Have a PTC product question you need answered fast? Chances are someone has asked it before. Learn about the community search. X
- Subscribe to RSS Feed
- Mark Topic as New
- Mark Topic as Read
- Float this Topic for Current User
- Bookmark
- Subscribe
- Mute
- Printer Friendly Page
How to draw 3D plot for the following program.
- Mark as New
- Bookmark
- Subscribe
- Mute
- Subscribe to RSS Feed
- Permalink
- Notify Moderator
How to draw 3D plot for the following program.
Hi all,
I need to plot 3-D plot for the following program which uses a AdamsBDF function
which is attached below.
Could anyone help me to make 3-D plot for the values of A, B and E
for my attached mathcad code ?
Thanks.
Solved! Go to Solution.
- Labels:
-
Physics
Accepted Solutions
- Mark as New
- Bookmark
- Subscribe
- Mute
- Subscribe to RSS Feed
- Permalink
- Notify Moderator
- Mark as New
- Bookmark
- Subscribe
- Mute
- Subscribe to RSS Feed
- Permalink
- Notify Moderator
- Mark as New
- Bookmark
- Subscribe
- Mute
- Subscribe to RSS Feed
- Permalink
- Notify Moderator
See please the Fig. 18.6. Solution of Differential Equations with Additional Parameter
here Study 18. Differential Equations in Thermal Engineering
- Mark as New
- Bookmark
- Subscribe
- Mute
- Subscribe to RSS Feed
- Permalink
- Notify Moderator
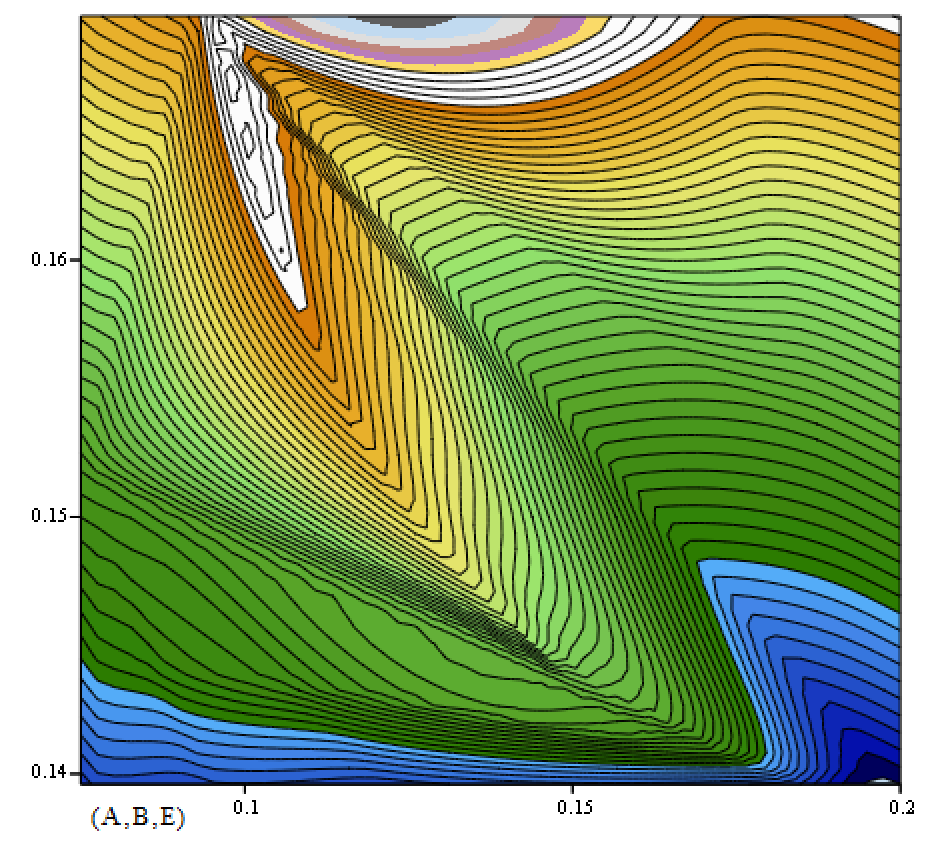
Counter plot: blue sea, green forest, snow mountain, volcanic crater etc. Fine picture!

- Mark as New
- Bookmark
- Subscribe
- Mute
- Subscribe to RSS Feed
- Permalink
- Notify Moderator
Dear Valery Ochkov,
Thank you very much for your answer.
But, I cannot able to see the 3-D plot in the code you attached.
I can just the box containing values (A,B,E).
Could you tell please what will be the problem ?
- Mark as New
- Bookmark
- Subscribe
- Mute
- Subscribe to RSS Feed
- Permalink
- Notify Moderator
- Mark as New
- Bookmark
- Subscribe
- Mute
- Subscribe to RSS Feed
- Permalink
- Notify Moderator
Right click the 3D region and uncheck "border" and see if this helps.
- Mark as New
- Bookmark
- Subscribe
- Mute
- Subscribe to RSS Feed
- Permalink
- Notify Moderator
Dear Valery and Exinger,
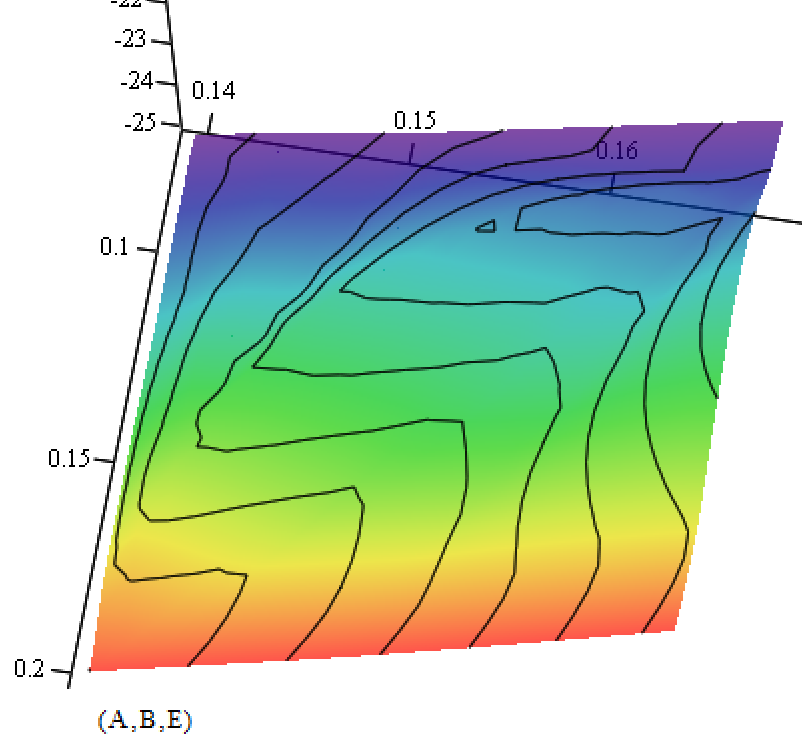
1. I can see the counter plot of Valery's attached file in test_3D_plot-2.
2. I followed the Werner's instructions, now I can see the 3D plot.
Thank you all.
- Mark as New
- Bookmark
- Subscribe
- Mute
- Subscribe to RSS Feed
- Permalink
- Notify Moderator
vetri veeran написал(а):
Dear Valery and Exinger,
1. I can see the counter plot of Valery's attached file in test_3D_plot-2.
2. I followed the Werner's instructions, now I can see the 3D plot.
Thank you all.
But the counter plot is more fine. Not true?
Point me please one physical meaning of the plot!
- Mark as New
- Bookmark
- Subscribe
- Mute
- Subscribe to RSS Feed
- Permalink
- Notify Moderator
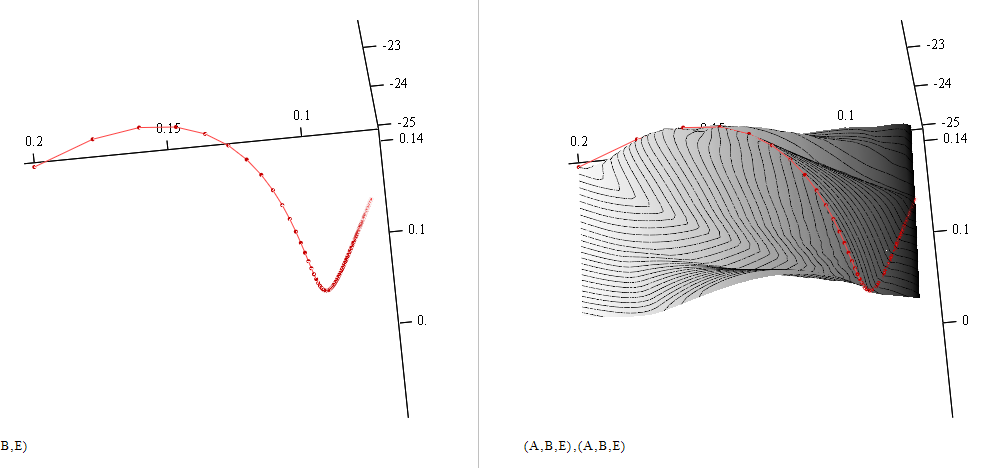
Are you sure that you are looking for a surface plot and not a simple curve in 3D-space?
After all thats all the information you have. Look a the pic below. You simply have to change the plot type from "surface plot" to "scatter plot" (or "Data points").

BTW, does anybody knows what kind of surface Mathcad's 3Dplot component does create in a case like this?
Werner


