Community Tip - When posting, your subject should be specific and summarize your question. Here are some additional tips on asking a great question. X
- Subscribe to RSS Feed
- Mark Topic as New
- Mark Topic as Read
- Float this Topic for Current User
- Bookmark
- Subscribe
- Mute
- Printer Friendly Page
Impulse Train
- Mark as New
- Bookmark
- Subscribe
- Mute
- Subscribe to RSS Feed
- Permalink
- Notify Moderator
Impulse Train
Another weeke another problem I need help with solving in Mathcad.
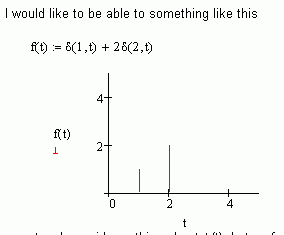
I have beed tiying to gt mathcad to sketch an impuls train, But I can't after the troubles i had with vectors im not suer if there is an easy way to do it but I would like to hear, if you have a way of doing it other than transforming the impulses to vectores and then plotting the vector in.
There are more details in the worksheet
Regards
Anton
Solved! Go to Solution.
Accepted Solutions
- Mark as New
- Bookmark
- Subscribe
- Mute
- Subscribe to RSS Feed
- Permalink
- Notify Moderator
- Mark as New
- Bookmark
- Subscribe
- Mute
- Subscribe to RSS Feed
- Permalink
- Notify Moderator
Will something like the attached do?
Alan
- Mark as New
- Bookmark
- Subscribe
- Mute
- Subscribe to RSS Feed
- Permalink
- Notify Moderator
I didn't even think to look there... but yes I think i will do nicly.
The only draw back is that it also shows the top of an triangle where f(t)=0 but it not a big problem since it is technicaly correct ![]()
SO thank you and if you have a tip on how to remove the trianles on f(t)=0 pleas tell ![]()
Regards
Anton
- Mark as New
- Bookmark
- Subscribe
- Mute
- Subscribe to RSS Feed
- Permalink
- Notify Moderator
SO thank you and if you have a tip on how to remove the trianles on f(t)=0 pleas tell
Define a range variable t:1;2 before the plot, and set the lower limit for the y-axis to 0.
- Mark as New
- Bookmark
- Subscribe
- Mute
- Subscribe to RSS Feed
- Permalink
- Notify Moderator
Yeah I can see how i can do that, I was hoping for another way. I mean the lees i have to define outside the graph the better.. or that is what i think anyway.
Anton
- Mark as New
- Bookmark
- Subscribe
- Mute
- Subscribe to RSS Feed
- Permalink
- Notify Moderator
Anton Jelle wrote:
...I was hoping for another way.....
Anton
You could choose Symbol Weight as 'p'. The arrow heads would still be there, but much smaller - barely visible when f(t) = 0.
Or set the minimum y value to something like 10^-8 (zero doesn't quite do it).
Alan
- Mark as New
- Bookmark
- Subscribe
- Mute
- Subscribe to RSS Feed
- Permalink
- Notify Moderator
Still a bit unclear what you want, exactly. But, you can certainly turn off the symbols on the plot and just get:


