Community Tip - Stay updated on what is happening on the PTC Community by subscribing to PTC Community Announcements. X
- Subscribe to RSS Feed
- Mark Topic as New
- Mark Topic as Read
- Float this Topic for Current User
- Bookmark
- Subscribe
- Mute
- Printer Friendly Page
Integrating Strain Function Not Converging
- Mark as New
- Bookmark
- Subscribe
- Mute
- Subscribe to RSS Feed
- Permalink
- Notify Moderator
Integrating Strain Function Not Converging
Hey all,
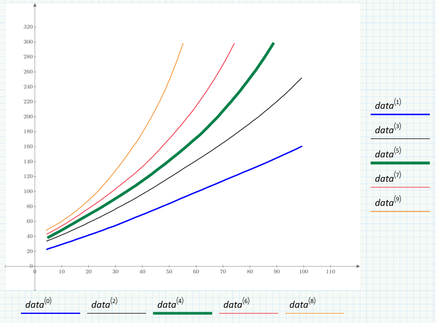
I'm trying to implement Mathcad's integration function to calculate ground settlement using a code-based correlation. Basically, the code presents a graphical figure that I've digitized (see attached PNG) and recast as a function of soil profile and depth. The first issue arises when I attempt to integrate the function that relies on N160, which becomes asymptotic as depth goes to zero. Mathcad returns the error message "The calculation is not converging to a solution...." The second issue is when trying to integrate log(sigma_vf/sigma_vo), since the denominator goes to zero as depth goes to zero.
Any suggestions? I'd prefer to keep things in functional form and simply "CTRL + SHIFT + I" (integrate) to calculate the settlement as a function of depth.
- Mark as New
- Bookmark
- Subscribe
- Mute
- Subscribe to RSS Feed
- Permalink
- Notify Moderator
The attached file is Mathcad Prime 3.0
- Mark as New
- Bookmark
- Subscribe
- Mute
- Subscribe to RSS Feed
- Permalink
- Notify Moderator
Hi,
The five lines do not line up in the original text file. You need to bring it into EXCEL to sort the columns of data so they line up then export as csv to read into Mathcad to keep the columns lined up. You can see how the data is currently read wrong by plotting the data.
Fix the data then we can talk about the rest of the file.
Cheers
Terry
- Mark as New
- Bookmark
- Subscribe
- Mute
- Subscribe to RSS Feed
- Permalink
- Notify Moderator
- Mark as New
- Bookmark
- Subscribe
- Mute
- Subscribe to RSS Feed
- Permalink
- Notify Moderator
Thanks for this, Terry.
I reviewed my input data file (.txt) and realized a couple errors. I've updated the data file to work w/ my lookup array and to properly filter NaN's as the text file has five (5) x-y traces of varying number of indices for each trace. The updated Mathcad Prime 3.0 file and .txt file are attached w/ some screenshots highlighting my attempt to integrate the C(z) function - still trying to figure that one out.
- Mark as New
- Bookmark
- Subscribe
- Mute
- Subscribe to RSS Feed
- Permalink
- Notify Moderator
Not sure whats wrong, but here is a possible workaround (redefinition of C)
- Mark as New
- Bookmark
- Subscribe
- Mute
- Subscribe to RSS Feed
- Permalink
- Notify Moderator
Hi,
You need to redefine the calculation of "n(z)" based on the index of the columns in the data matrix.
Cheers
Terry
- Mark as New
- Bookmark
- Subscribe
- Mute
- Subscribe to RSS Feed
- Permalink
- Notify Moderator
@terryhendicott wrote:
Hi,
You need to redefine the calculation of "n(z)" based on the index of the columns in the data matrix.
This does not solve the integration problem, but the plots definitely look a bit more reasonable 😉
- Mark as New
- Bookmark
- Subscribe
- Mute
- Subscribe to RSS Feed
- Permalink
- Notify Moderator
Hi,
The import of the data is still not perfect. Part of the last line (columns 8,9) is missing. Part of the second line (columns 2,3) is composed of data from the third line (column 4,5)
correct import from a csv file is possible
Cheers
Terry
- Mark as New
- Bookmark
- Subscribe
- Mute
- Subscribe to RSS Feed
- Permalink
- Notify Moderator
Can't duplicate that effect using the last sheet the OP posted.
Using your csv-file instead of the originial txt-file seems to have no effect - the integral problem still exists.
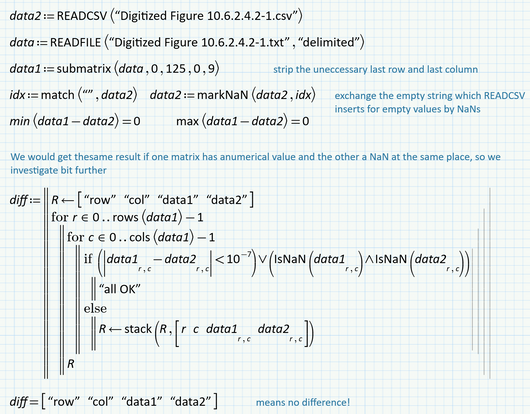
EDIT: I jsut gave it a try and compared. The matrix data created by the OP's last txt-file and the one created by your csv-file are identical (up to 10^-7 precision). The only difference is that you omitted the last line and the last column (which are the result of the text "blank" in the txt-file).
- Mark as New
- Bookmark
- Subscribe
- Mute
- Subscribe to RSS Feed
- Permalink
- Notify Moderator
It doesn't seem to like something in the data file, it appears. I tried a b-spline and it wouldn't solve.
Pasting in a simple x&y set from Terry's file everything was fine.
OR=ORIGIN
- Mark as New
- Bookmark
- Subscribe
- Mute
- Subscribe to RSS Feed
- Permalink
- Notify Moderator
From your pic we don't see which data you used and which failed.
As I explained and showed above, the only difference between the OP's data and Terry's is the last row and the last column (NaN's) and of course the empty strings "" vs. NaN's if you read in via READCSV.
Furthermore you may notice that for the integral in question none of the data columns is directly the variable of integration as you seemed to have assumed. Just look at the file of the OP.


